
The enthalpy-pressure chart- DRY AIR TURBINE
1.1 Our working model for the discussion
Here is a sketch of a closed loop Latent Power Turbine with some estimated prototype values added.
Figure 1. We draw attention to the fact that lagging is required between the fan and the mouth of the Venturi constriction.
For visual simplicity we have drawn a conduit with rather sharp corners and placed the fan and turbine in opposite halves of the conduit. In reality, rounded corners are preferred and the fan is mounted just in front of the Venturi constriction.
1.2 The four main heat processes involved.
In the vicinity of the turbine, the heat exchange processes are complicated because there are two cooling and two heating effects:
Cooling
(i) Venturi cooling,
(ii) cooling due to external work being done
Heating
(i) a temperature increase due to friction,
(ii) an increase in temperature due to the flow of heat through the conduit walls.
2.1
We will construct the chart in two stages in order to tease out the effects of the four heat exchange processes.
Stage 1 of 2 in building up the diagram.
We will introduce two simplifications:
(i) The turbine shaft will be clamped so that there is no power output.
(ii) The region around the Venturi constriction will be lagged.
In reality, lagging the constriction is not wise because it wastes a good opportunity to draw in heat. But it has the analytical advantage that the two cooling mechanisms listed above can be separated out.
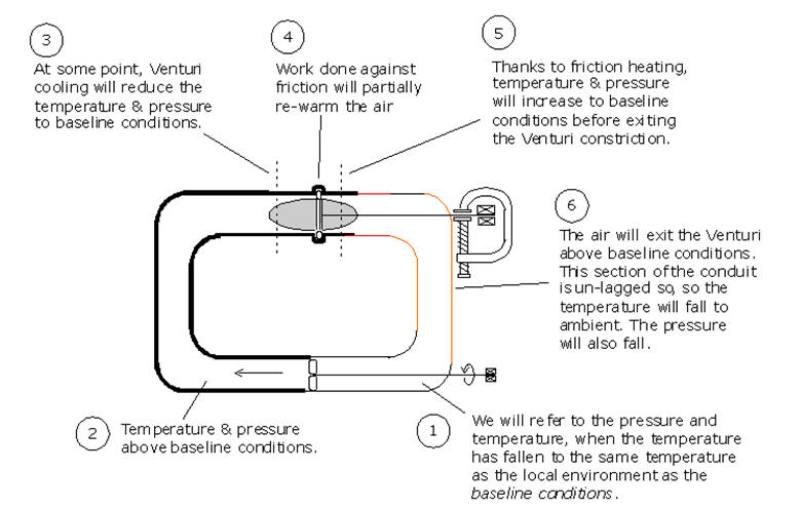
Figure 2. If there is no power output, the system pumps heat into the environment. (If the conduit is completely lagged, net work is done on the system and the internal temperature will gradually increase over time.)
2.2 Stage 2 of 2 in building up the diagram.
The system will now be used to produce cooling and a net power output.
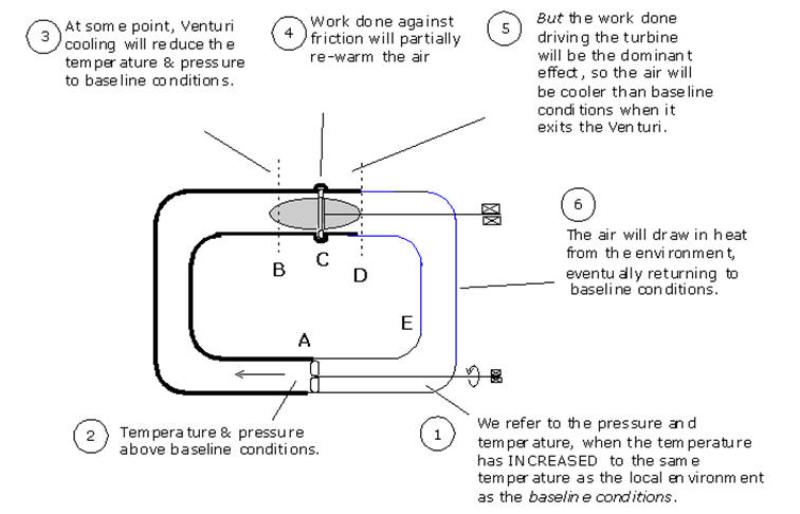
Figure 3. This system generates electricity at the cost of drawing in heat through the conduit walls.
The letters A to E relate to points on the enthalpy-pressure chart below.
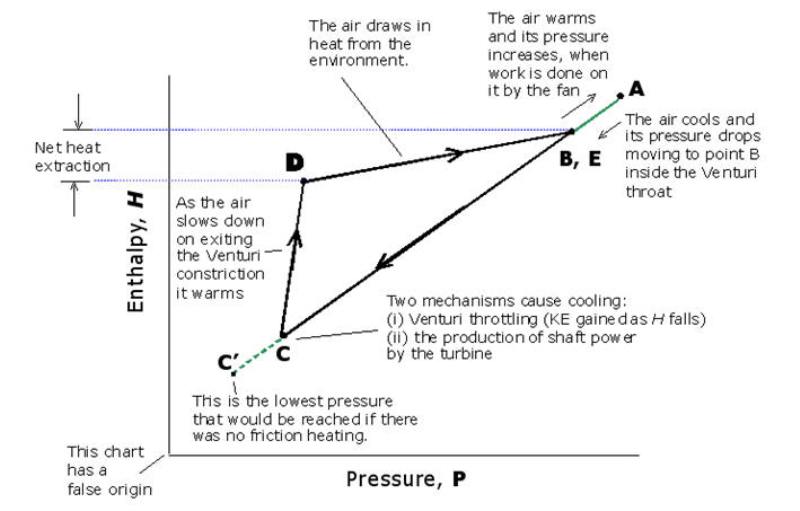
Figure 4. The Pressure Enthalpy chart.
For simplicity we have assumed that all of the friction heat losses occur in the vicinity of the turbine. This is not strictly true, but:
(i) The air travels relatively slowly through the wider conduit and fan, so because the air friction is a function of velocity2, this is a fair first approximation.
(ii) For practical purposes, the nuisance value of the air friction is the same, wherever it occurs on the chart.
Moist air Latent Power Turbines
The two charts are similar, with the difference being that for moist air turbines, the energy source is latent heat released when moisture condenses.