
Converting swards into ploughshares
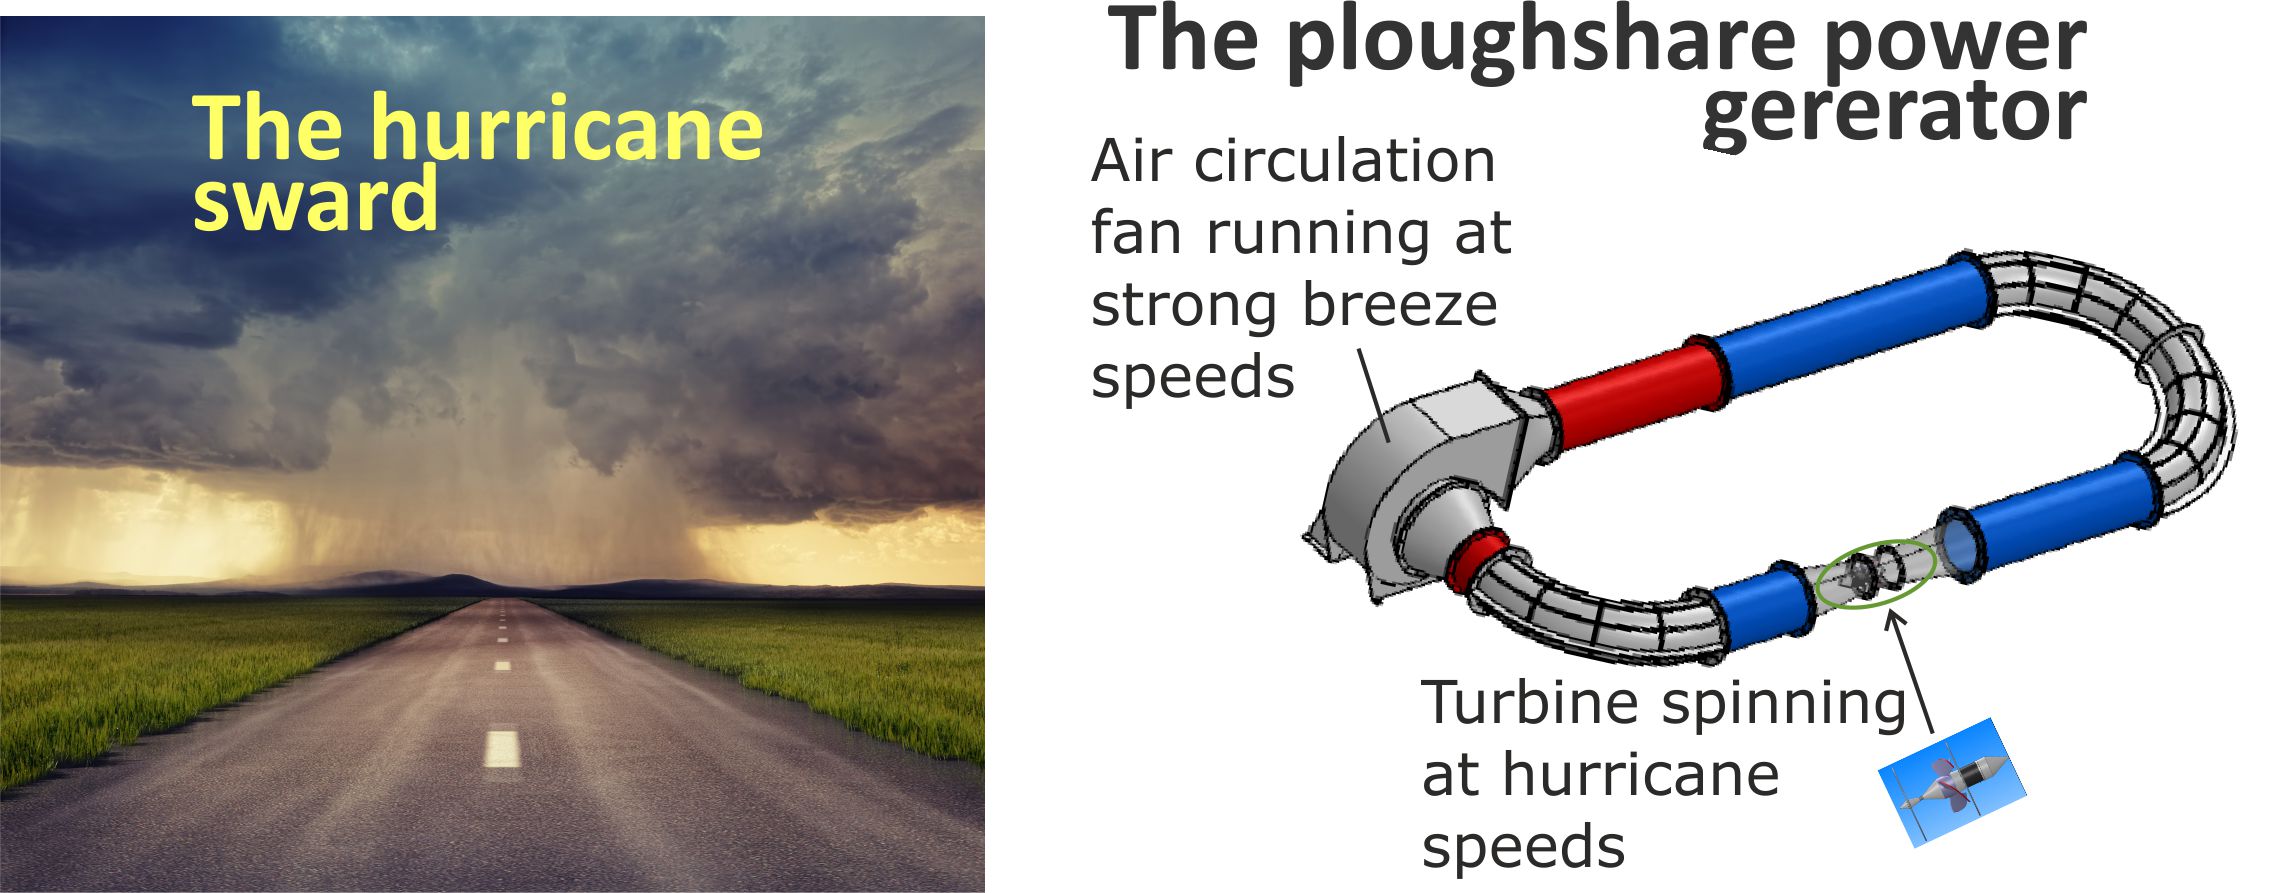
Fig 1. Scientists tell us that global warming is producing increasingly violent weather.
Latent Power Turbines are a ‘swards to ploughshares’ invention that reproduce hurricane strength wind speeds inside a closed metal loop and use this to generate electricity.
They are similar to heat pumps in that they can run on thermal energy extracted from the atmosphere or ground.
During heat waves, the cooled atmospheric air can be used to provide free indoor air cooling.
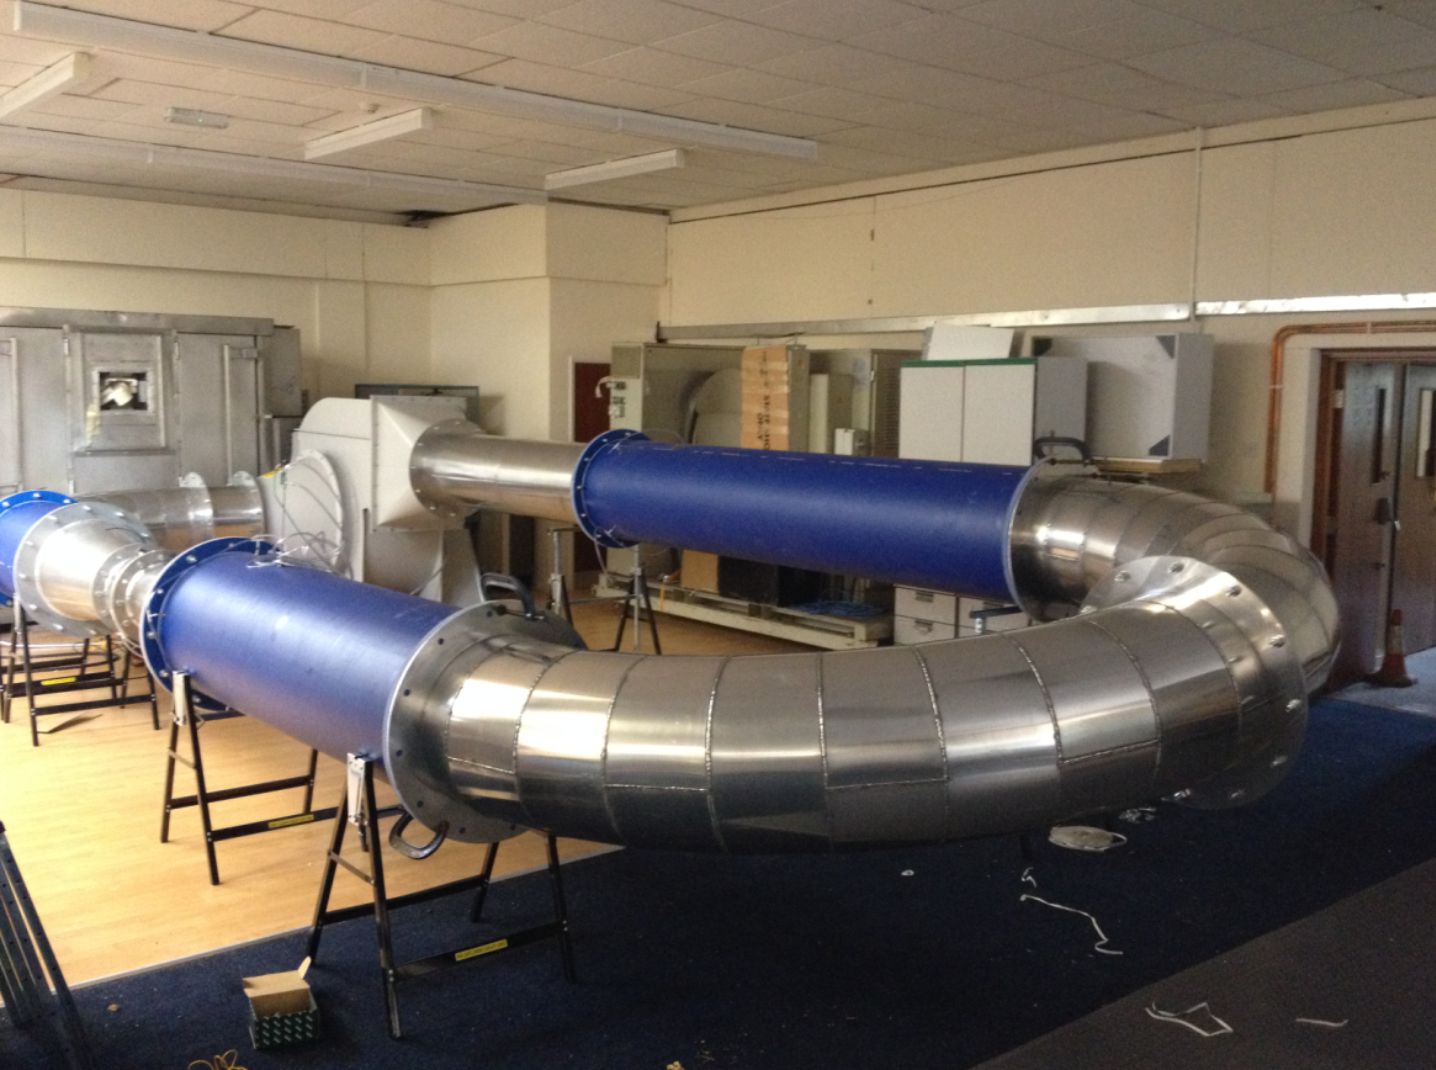
Fig 2. The Mk 2 Latent Power Turbine imitates the violent winds that we humans are making worse by polluting the atmosphere.
A key feature of the design is that the power generating section is placed inside a converging- diverging length of metal tube. This allows Latent Power Turbines to imitate the highly efficient convection currents that produce thunder storms and hurricanes.
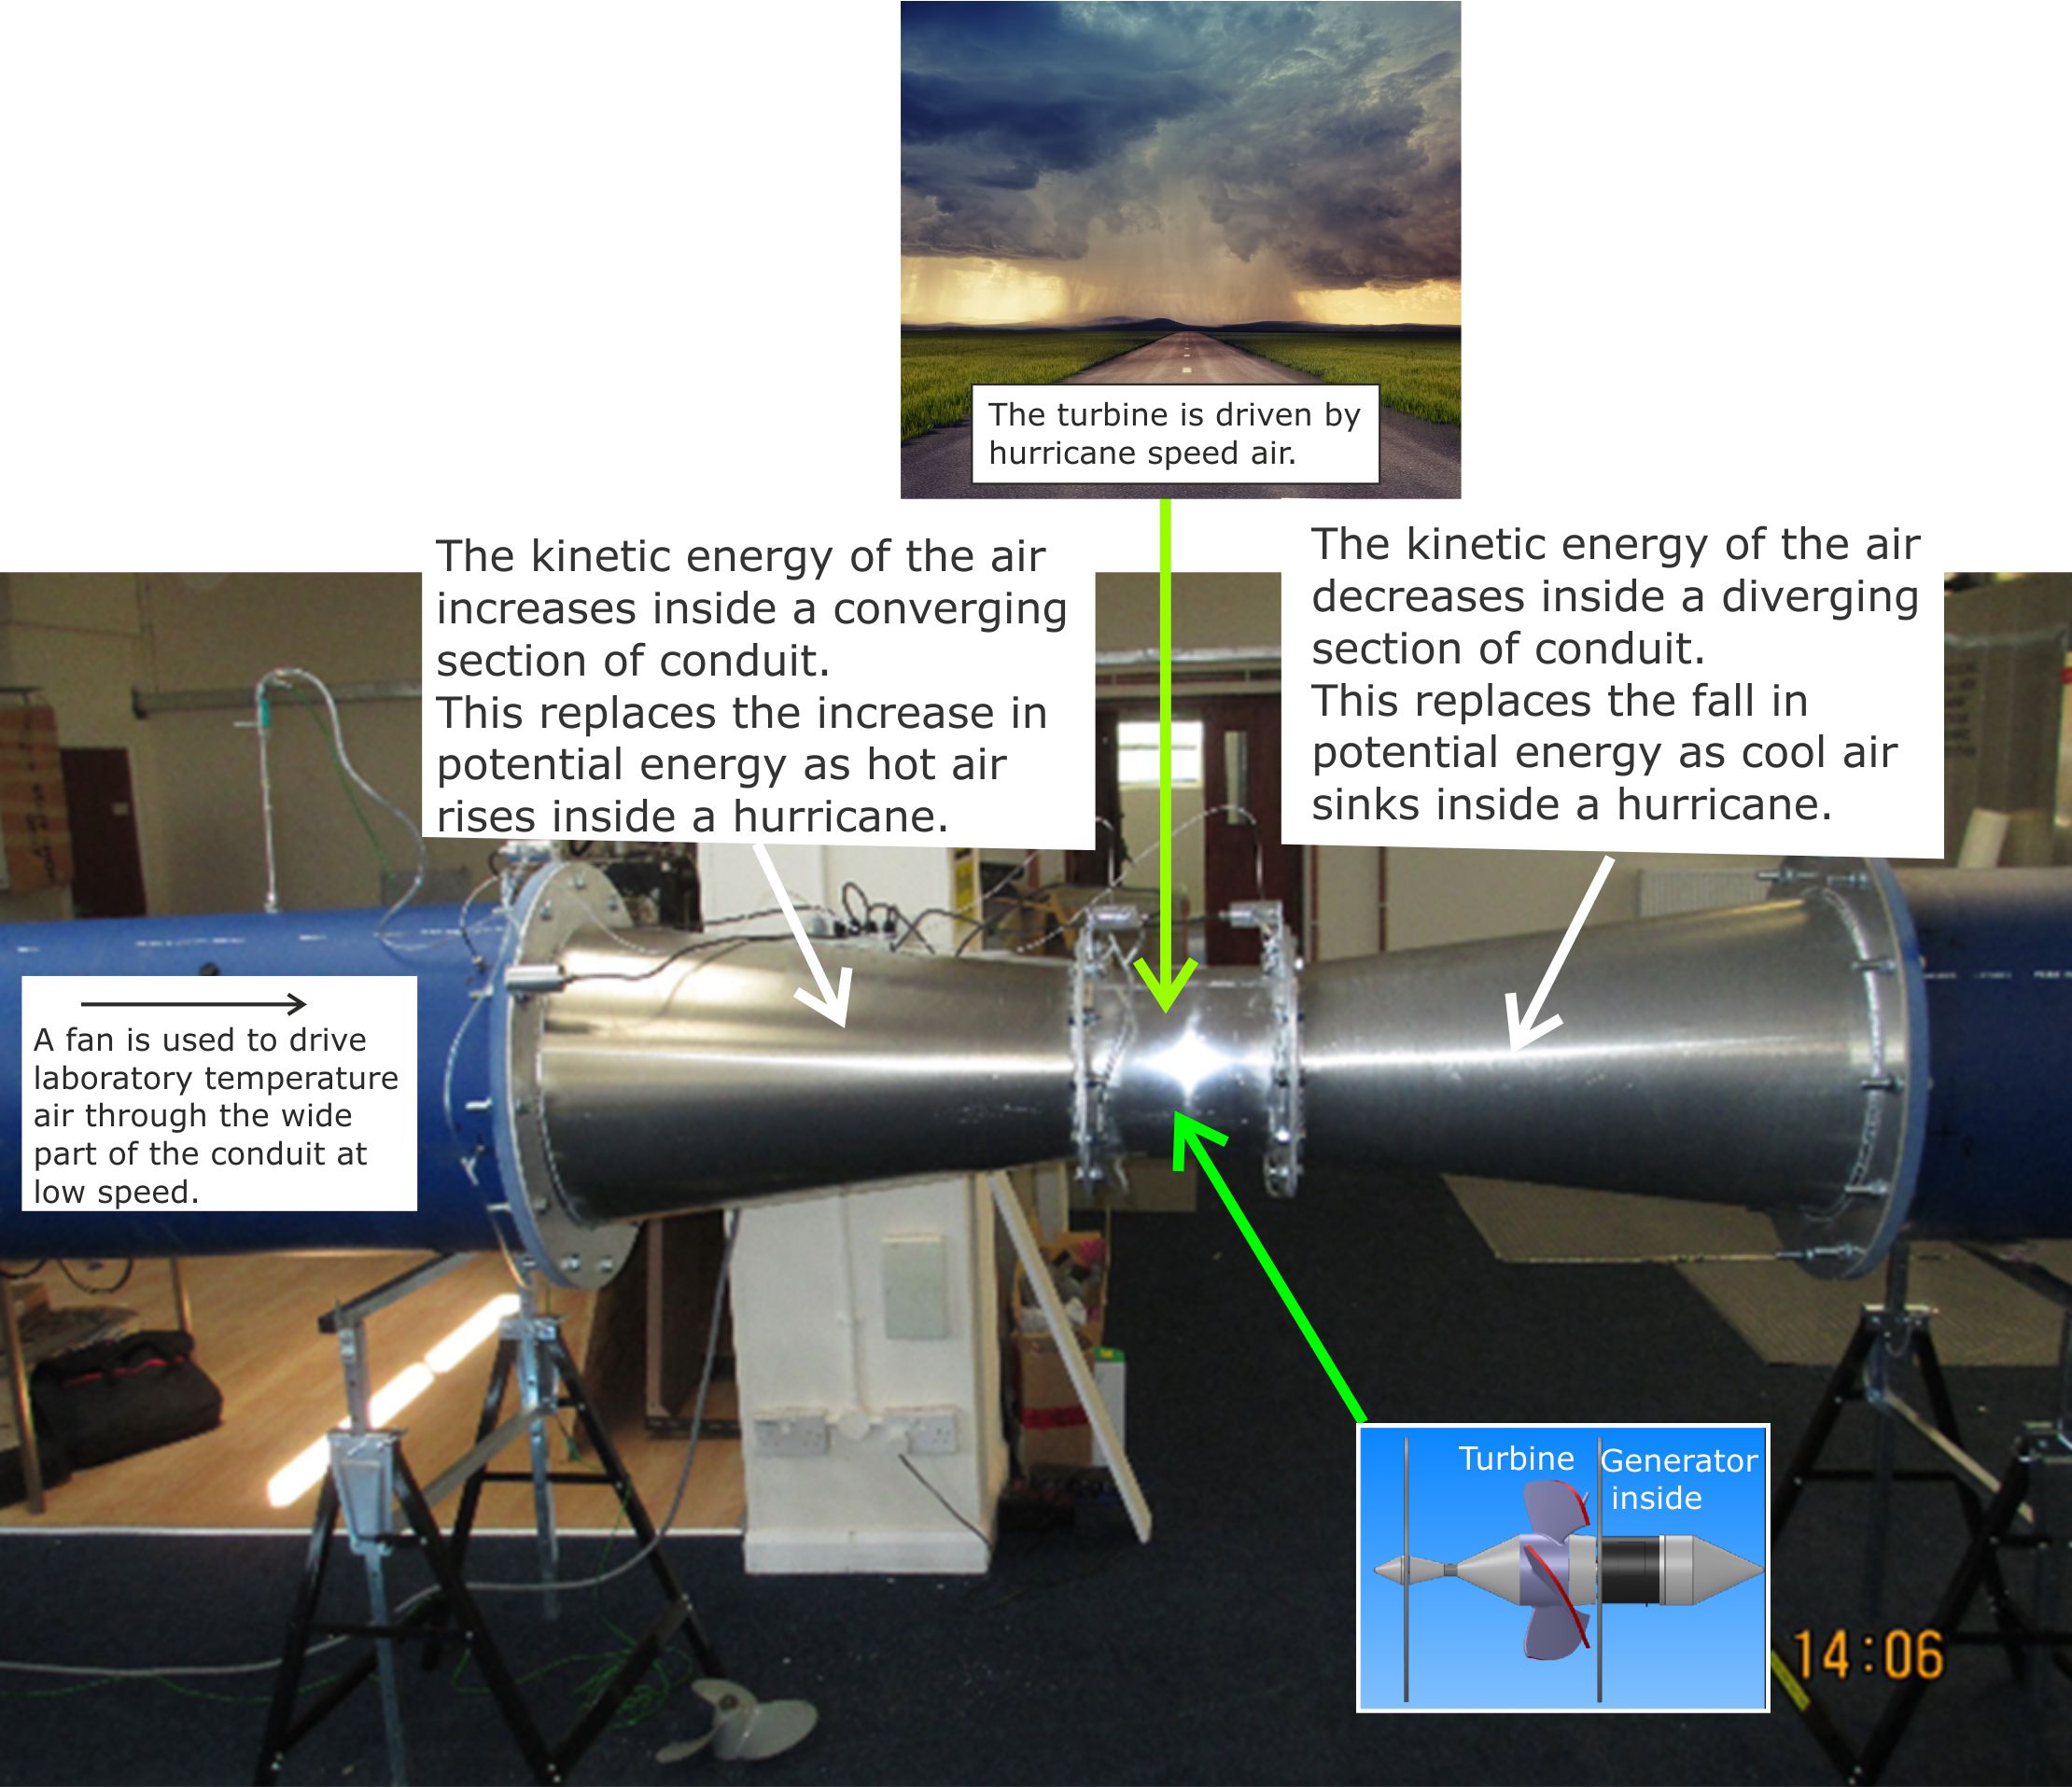
Fig 3. The converging section replaces the hot rising air in the hurricane eyewall, and the diverging section replaces the cool sinking air inside the hurricane eye.
Latent Power Turbines work with nature instead of fighting it
Carbon dioxide (CO2) is the dominant gas causing our global warming problems. This gas is necessary in small quantities for plant growth. But since the start of the industrial revolution, we have been throwing nature out of balance by burning fossil fuels in heat engines.
So, what are these heat engines that are creating global warming?
Any form of engine that converts thermal energy (as associated with warmth) into dynamic energy (as associated with motion or potential to move) is a heat engine.
The manufactured heat engines described in the engineering textbooks include petrol, diesel and jet engines, the gas and steam turbines used to generate electricity and the steam engines that launched the industrial revolution.
Convection currents in which thermal energy produces vertical gas or liquid movements are also heat engines.
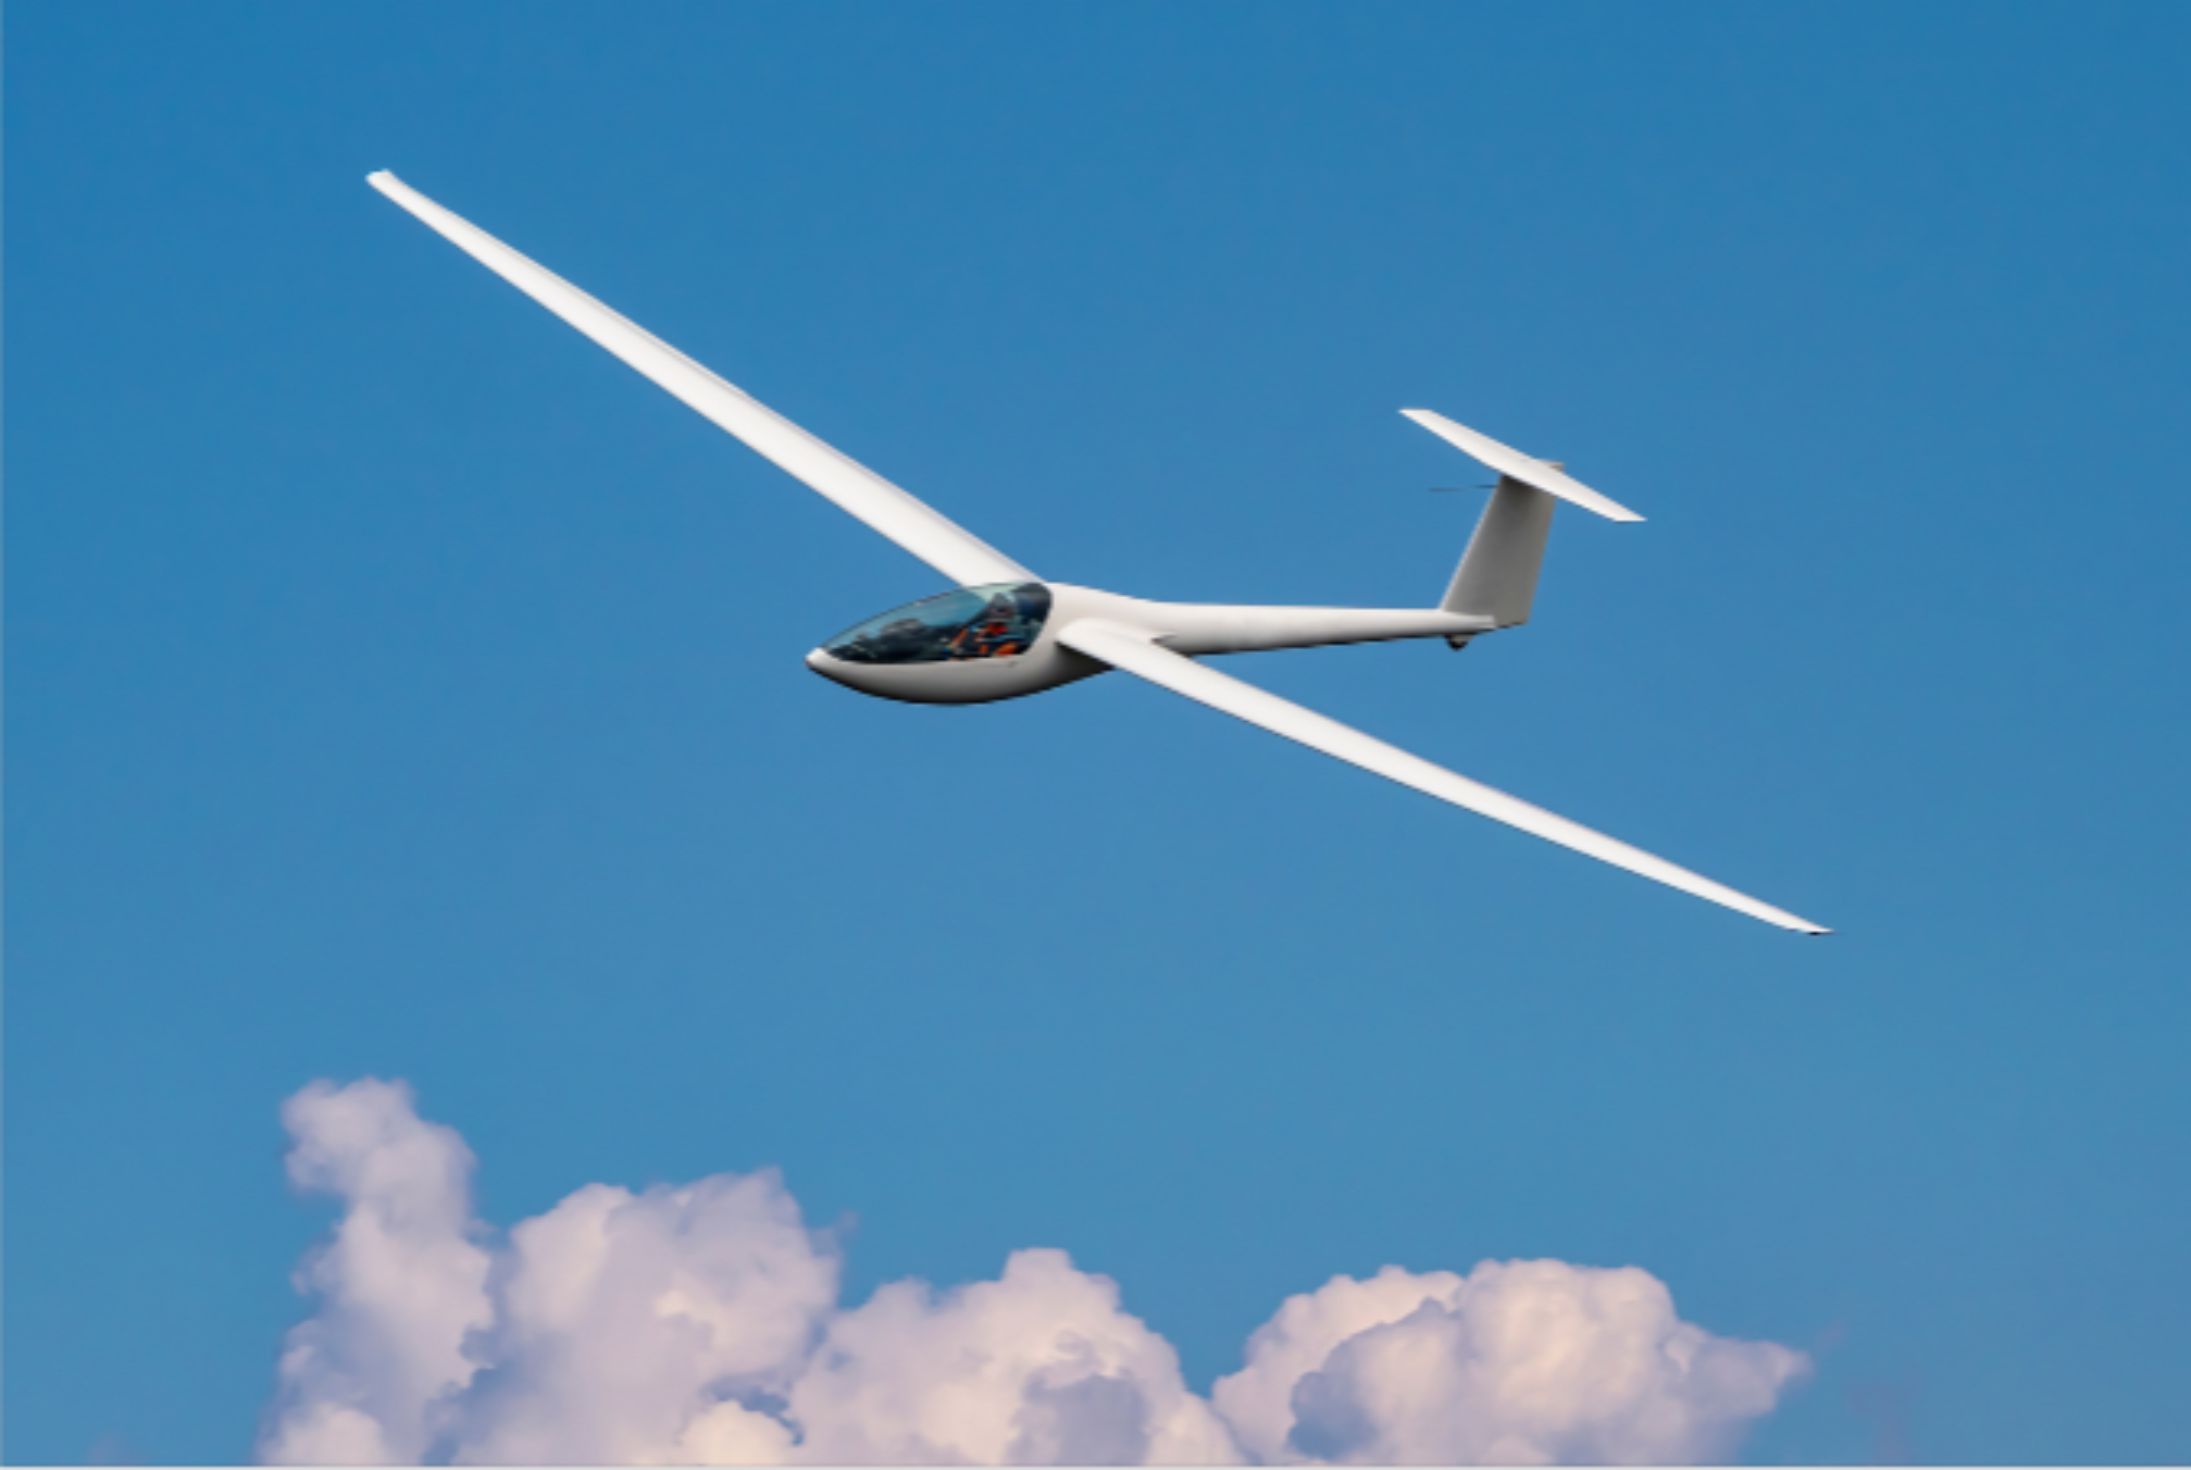
Fig 4. In this example of a natural heat engine, thermal energy is converted into the dynamic energy of rising air. It allows the glider to rises against the pull of gravity and gain potential energy.
Thermodynamics is the branch of science that explains how natural heat engines allow gliders to fly.
The same science applies to the manufactured heat engines that are damaging our atmosphere.
In our research we have compared natural and manufactured heat engines in an attempt to learn from nature.
Here is a list of the heat engines that have influenced Latent Power Turbine design.
|
Manufactured heat engines that cause climate change |
Natural heat engines that suffer from climate change |
|
Internal combustion engines in all forms of transport. |
Atmospheric convection currents |
|
Power station gas and steam turbines |
Ocean water convection currents |
|
Old time steam engines in trains and factories |
The following table lists the features of manufactured and natural atmospheric heat engines that have influenced our thinking.
|
Manufactured heat engines (Existing designs) |
Natures atmospheric heat engines (Convection currents) |
|
They are clearly visible with solid outer bodies. |
They are a feature of the atmosphere and have no visible or solid parts. |
|
Run hot, typically 100 - 600oC. |
Run cool, with an average sea level temperature of 140C. |
|
Poor efficiency of 30% - 60% |
In spite of running cool, they are more efficient than manufactured heat engines. |
|
They are linear systems that commonly dump their rejected thermal energy into the atmosphere. |
They are circular systems that are forced to recycle their rejected thermal energy because it is dumped back into the same atmosphere that it came from. |
|
They are one way systems converting thermal energy into dynamic energy. |
They are two way systems, converting thermal energy into dynamic energy and vice versa. (As in the example below.) |
|
We now know that these engines process internal energy, not heat. But for historical reasons, the name heat engine has been retained. This labelling has led many engineers to believe that circular heat engines are thermodynamically impossible because heat cannot be recycled. |
Meteorologists are happy to live with the concept of circular heat engines for historical reasons. When Count Rumford discovered convection currents in 1797, there was no obvious link with steam engines. So the baggage of incorrect ‘heat engine’ labelling was avoided. |
Although they obey the same laws of thermodynamic, manufactured and atmospheric heat engines appear to be entirely unrelated. So it is not surprising that prior to the invention of Latent Power Turbines, nobody seems to have recognised the benefits of imitating convection currents.
The key difference that emerged from our studies was that manufactured heat engines are simple linear systems, whereas natural heat engines are more complex circular systems.
These diagrams illustrate the key difference.
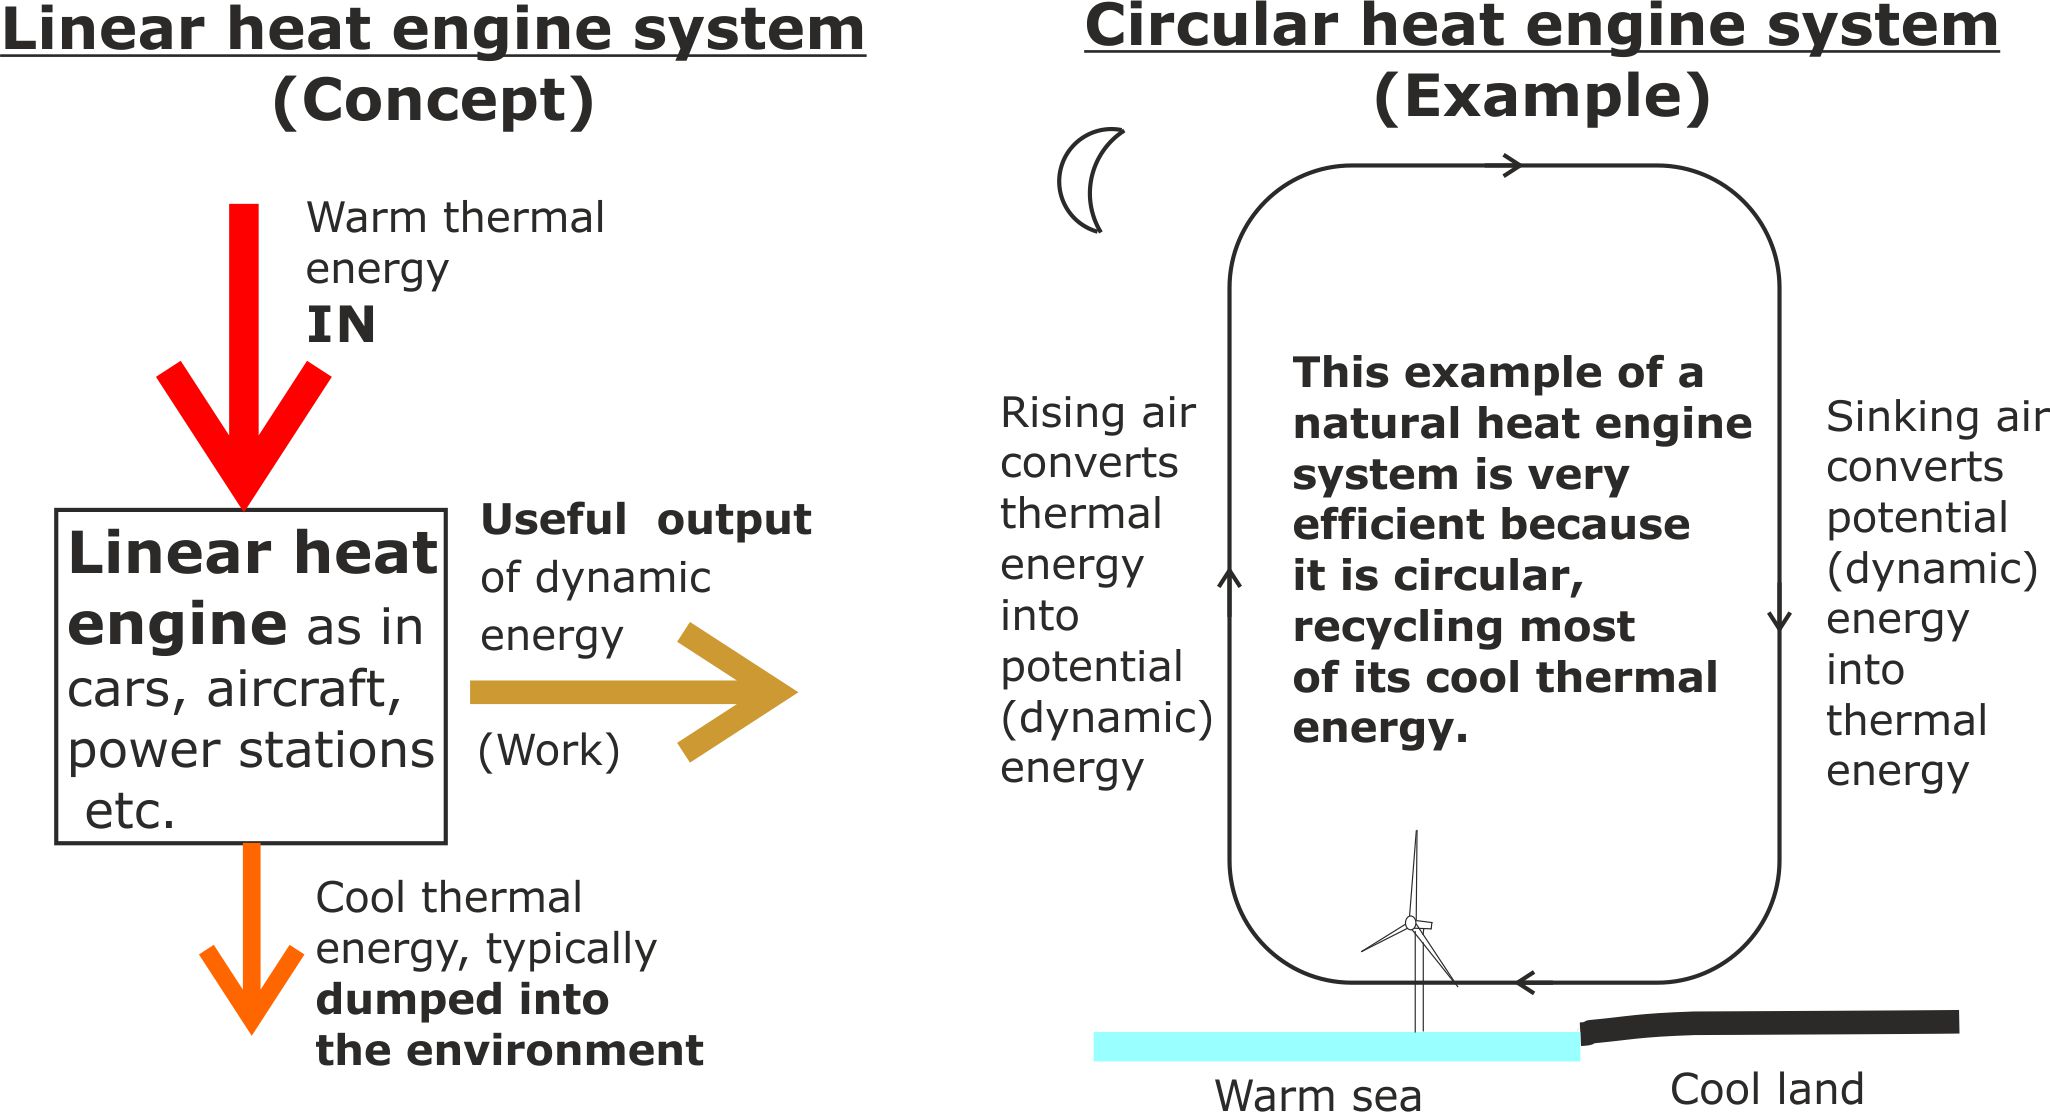
Fig 5. Our studies also revealed that
(i) Circular heat engine systems are composed of two or more linear heat engines forming a loop.
(ii) At least one heat engine must work in reverse, converting dynamic energy (kinetic or potential) into thermal energy.
Circular heat engines are essential for life on Earth because they keep our planet within the Goldilocks temperature range (not too hot and not too cold). They also transport water and other resources needed for life around our planet.
A linear heat engine atmosphere would be far too cold to sustain life, but we are unlikely to find one anywhere in the universe because its existence would violate the laws of thermodynamics.
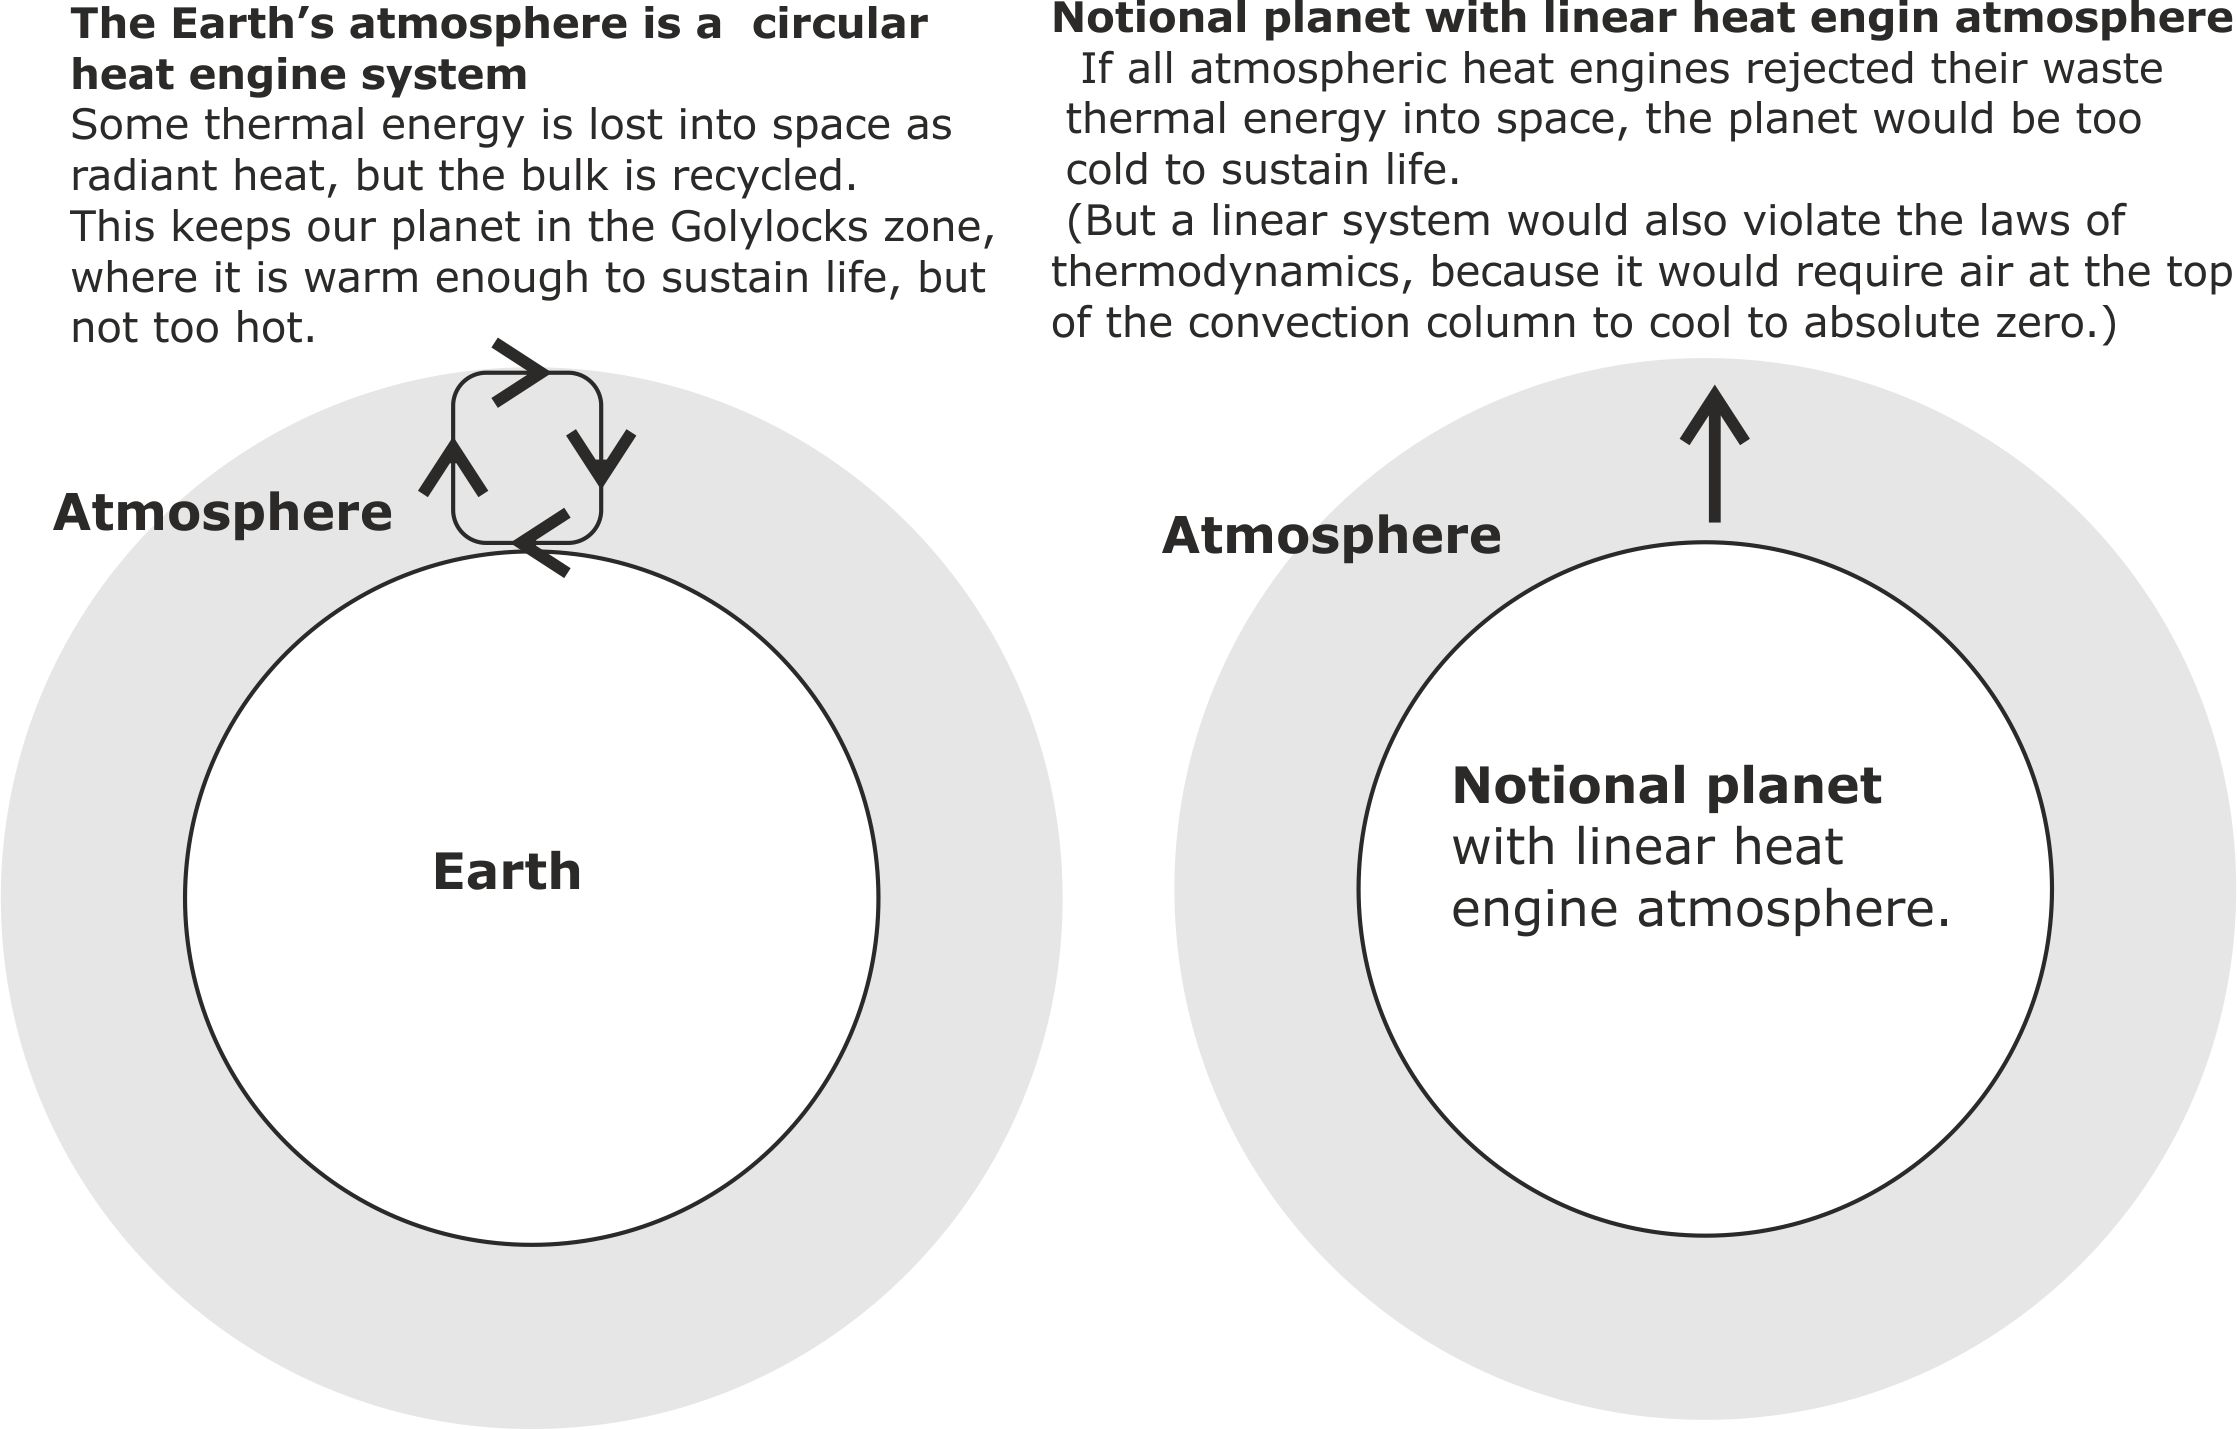
Fig 6. In order to maintain in thermal equilibrium with the sun, the rate at which the Earth radiates heat into space must always remain the same, whatever the composition of the atmosphere.
So, over the course of a year, the equilibrium condition is that
Total thermal energy received from the sun
+ heat from the core of the Earth
= Total thermal energy radiated into space
Global warming does not change this equation. But, by burning fossil fuels (and other means) we are slightly changing the composition of the atmosphere. This changes the atmospheres radiant heat properties. This in turn, forces it to warm up to maintain its thermal balance with the sun.
Ironically, the high efficiency of our circular heat engine atmosphere is now working against us by making the atmospheric heat engines too efficient. This means that they have to run hotter in order to remain in balance with the sun. These hotter running natural heat engines are also creating more extreme weather patterns.
The following diagrams summarise the problem we have created.
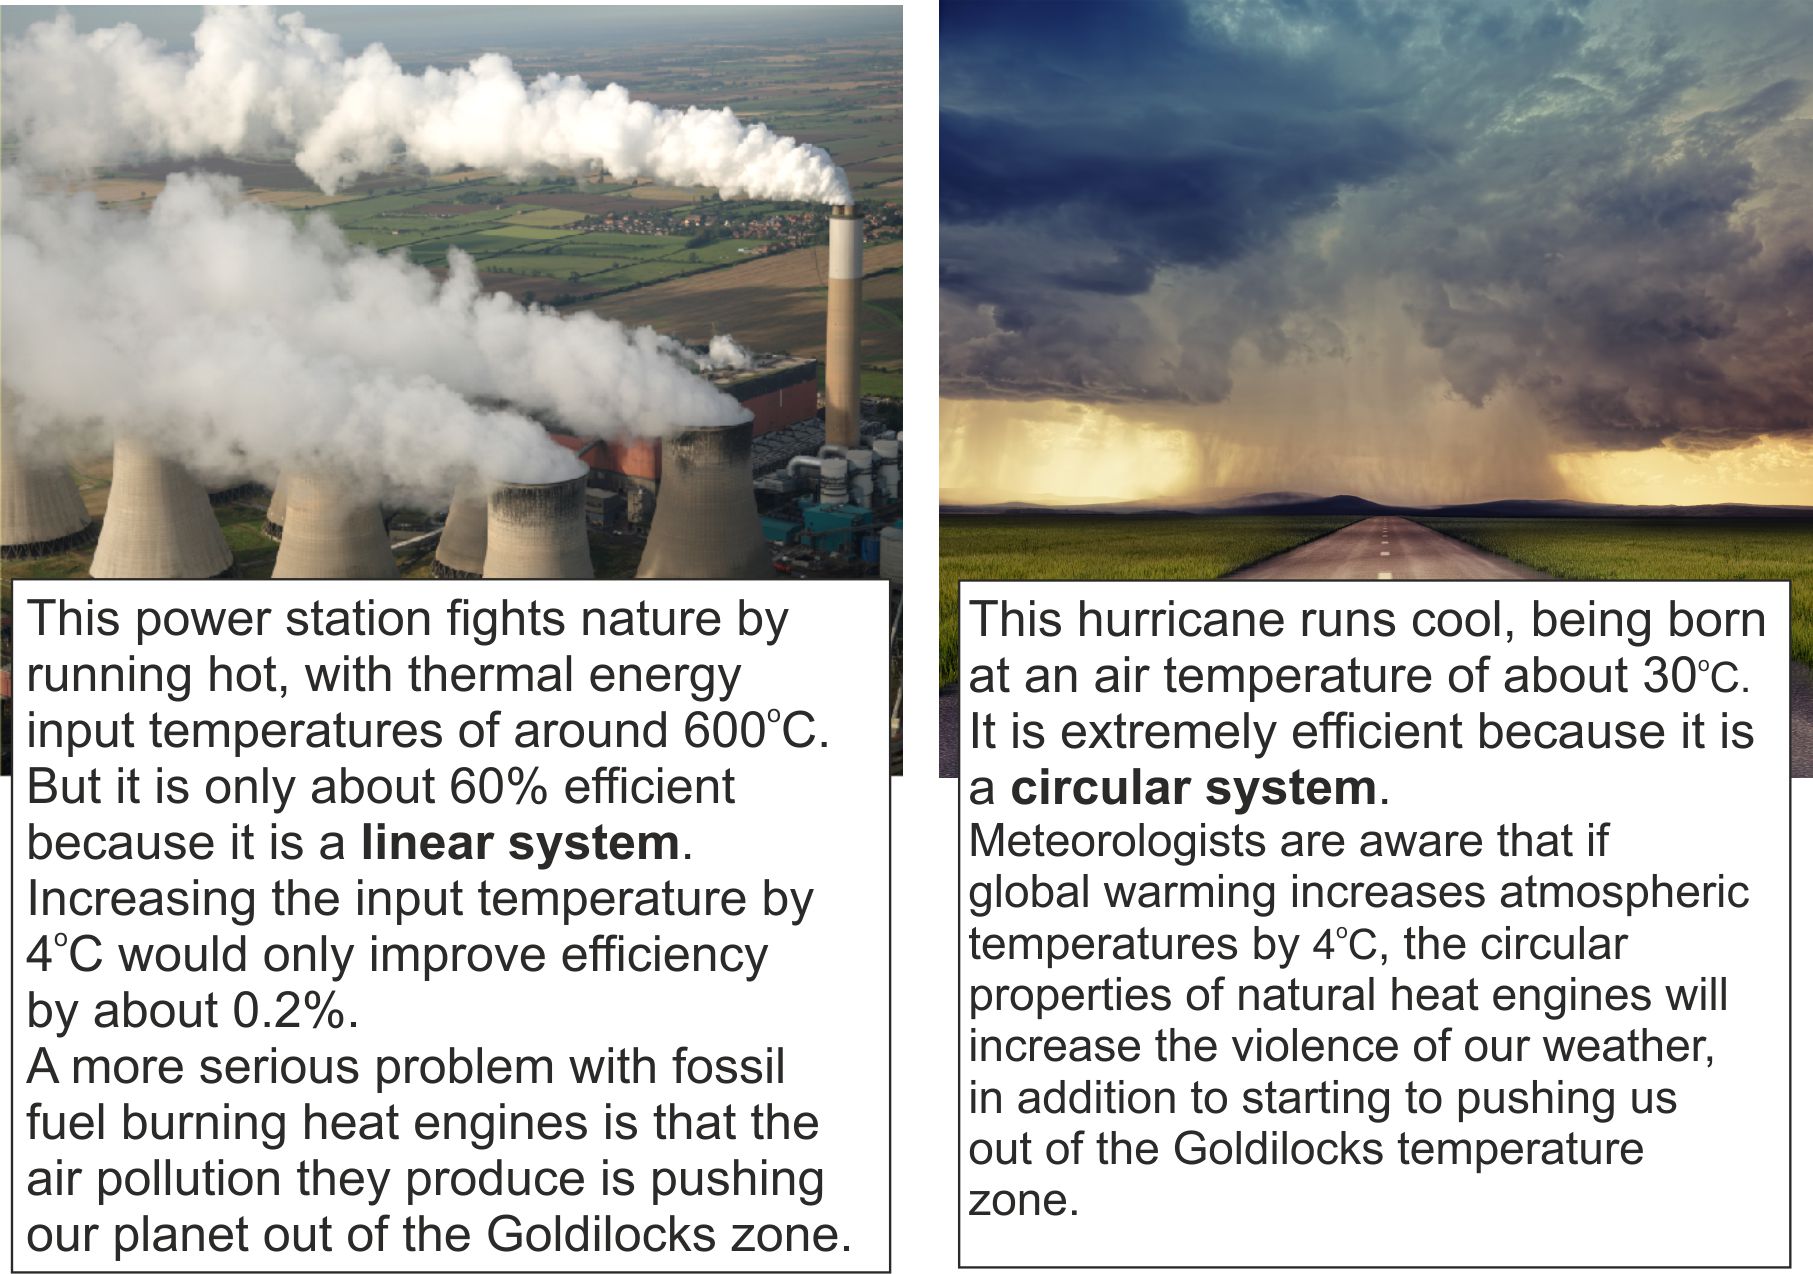
Fig 7. Nature’s highly efficient hurricanes run cool at around 30oC, while power station steam turbines run hot at around 600oC. The conventional thinking on how we can reduce the efficiency gap is by fighting against nature and running our engines even hotter; reaching as high as 1,700oC inside the combustion chamber of a jet engine.
The Latent Power Turbine approach turns conventional engineering thinking on its head.
We have studied nature to see what tricks it uses, and then designed cool running heat engines that copy them.
The following diagram explains how hurricanes convection currents achieve far higher efficiencies than power station systems, even though the water vapour in the hurricane eyewall is a lot cooler than the water vapour inside a steam turbine.
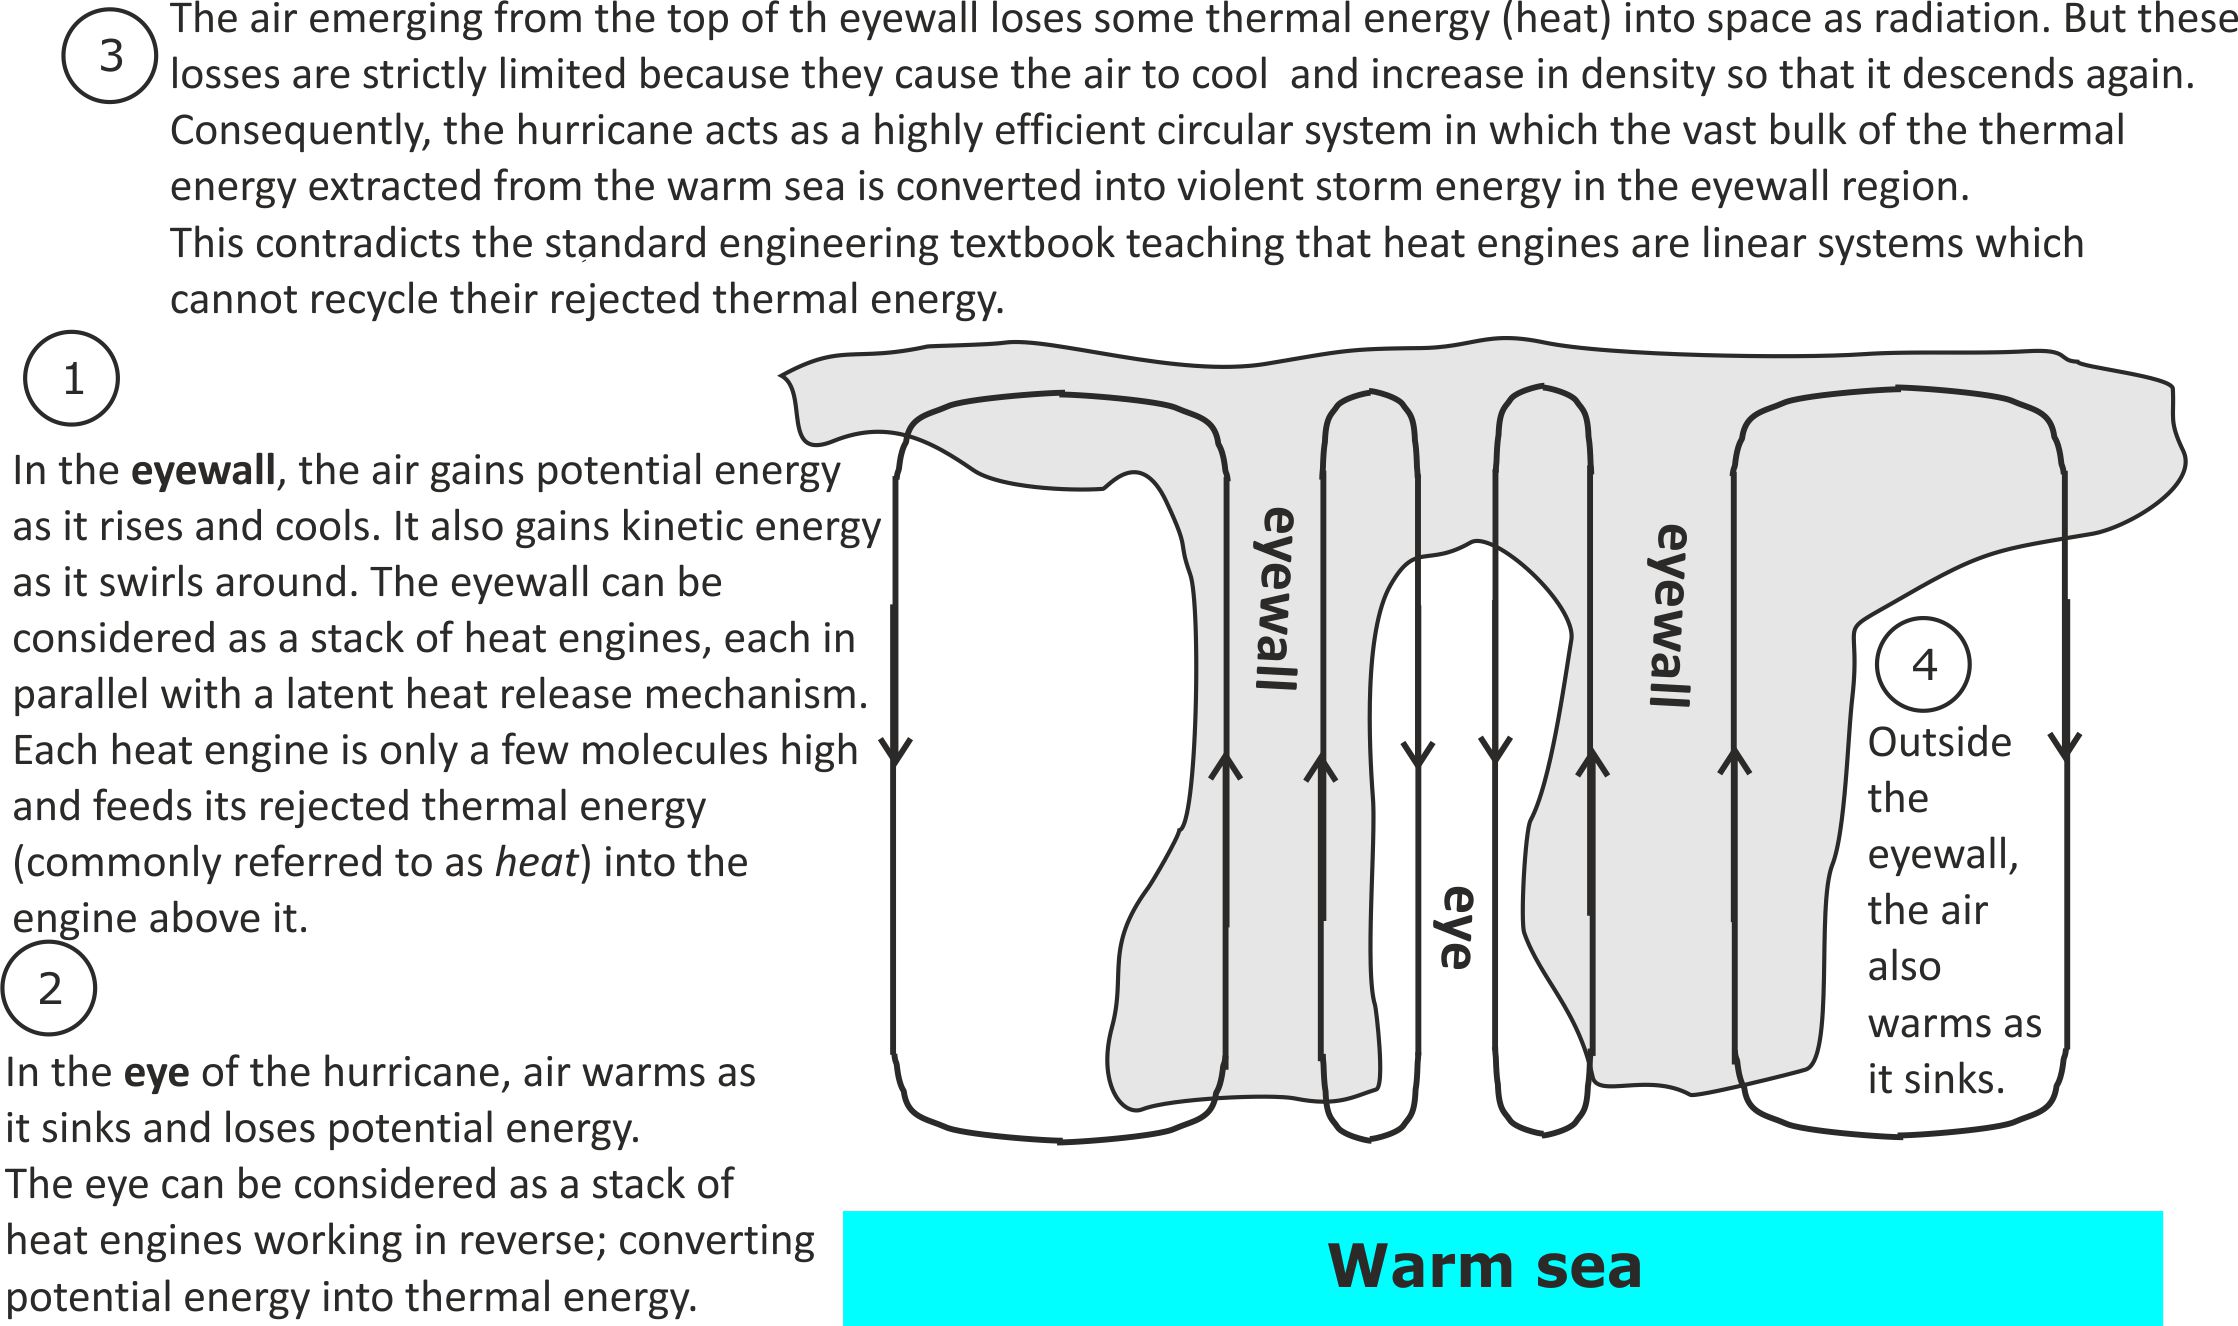
Figure 8. The air inside a hurricane flows round in loops; with warm humid air rising and cool dry air sinking. This creates a circular heat engine system that recycles thermal energy instead of wasting it.
So, why have engineers chosen to fight nature by building ever hotter heat engines?
A journal paper to be published in late spring 2022 discusses how we can build a new class of cool running circular heat engines that imitate nature. It also provides an explanation for the blind spot in our heat engine thinking.
Courtney, W, ‘Cool running heat engines’ Journal of Biological Physics and Chemistry 21
Here is a plausible explanation for our blind spot.
Our failure to build circular heat engines can be put down to two historical reasons.
(i) Every single heat engine that has achieved commercial success since the start of the industrial revolution has been a hot running linear heat engine.
(ii) During the first 150 years of the industrial revolution, the caloric theory of heat was accepted. This theory failed to distinguish between heat and internal energy. But it was still a very useful thinking tool for designing steam engines.
These diagrams explain our modern understanding of the difference between internal energy and heat.
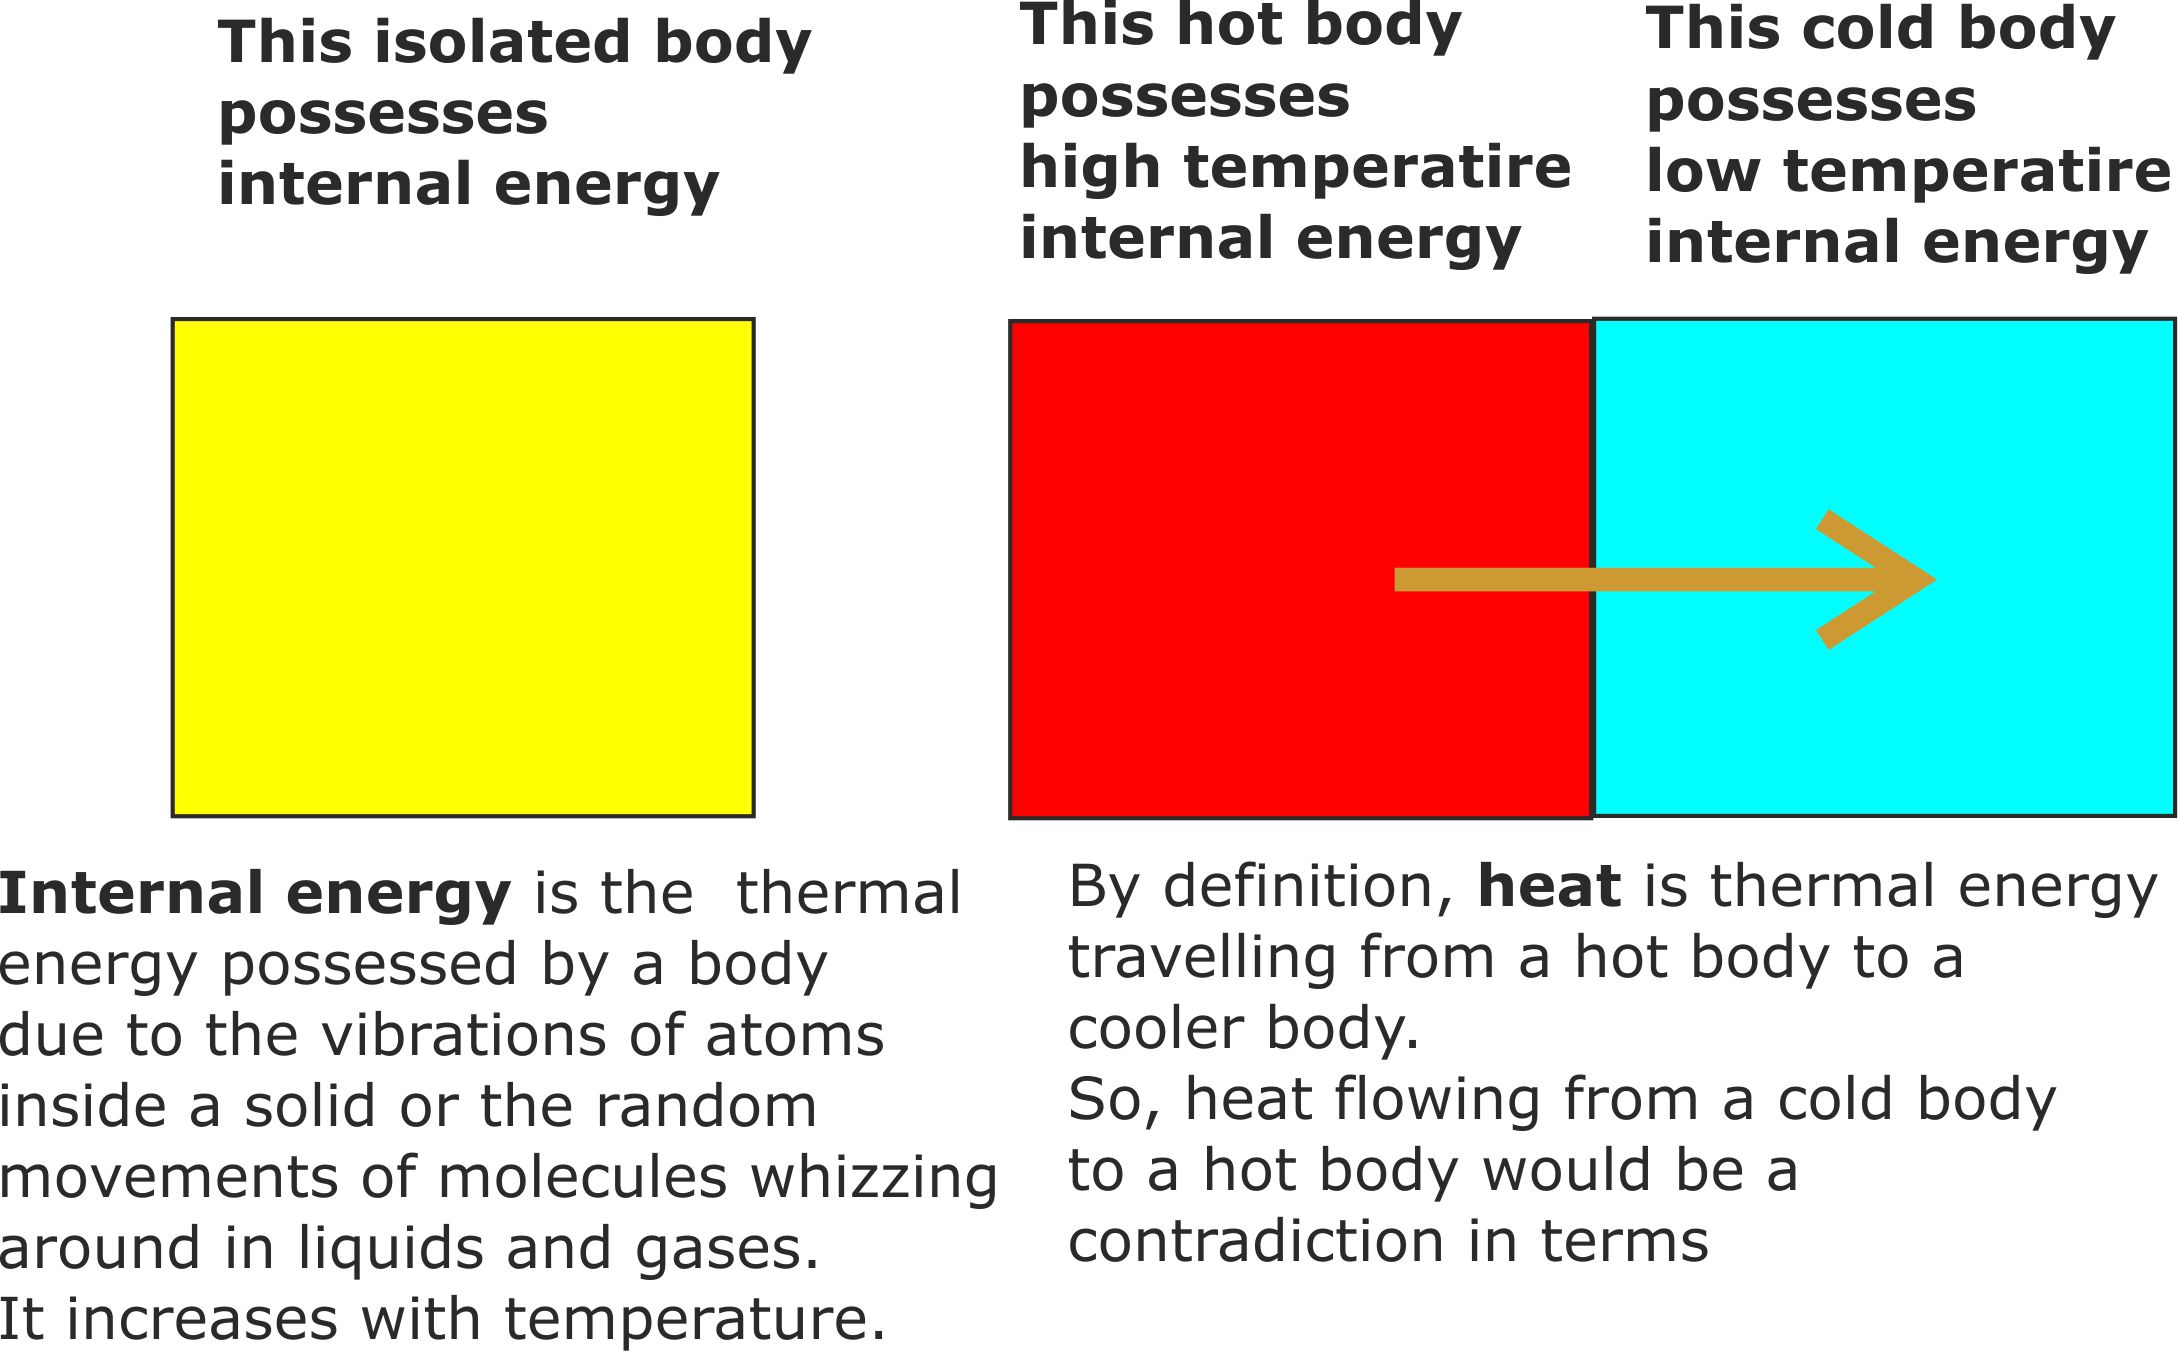
Figure 9. This definition of heat is based on many observations of thermal energy flow plus the laws of thermodynamics. So it is not an arbitrary definition that is liable to change.
It was only in the second half of the nineteenth century when there was widespread acceptance that matter was made of atoms and molecules that it became useful to distinguish between heat and internal energy.
Prior to that, during the caloric theory era, warm bodies were thought to hold a large quantity of an invisible weightless fluid called caloric. Cold bodies were assumed to hold less caloric. So when a warm body was placed in contact with a cold body, caloric flowed out of the war body and into the cool one. We now know that this theory is completely wrong. Nevertheless, the caloric concept was still useful to engineers and scientists.
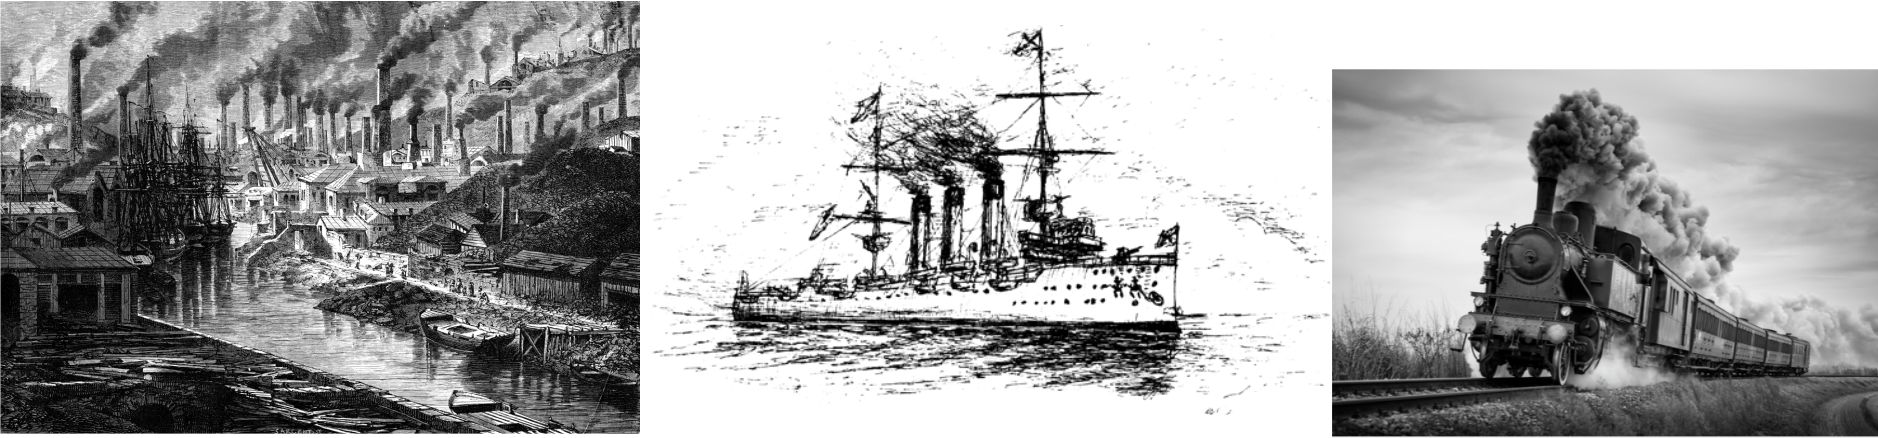
Figure 10. During an era when Western industrialisation and empire building was symbolised by smoke billowing steam engines, the simplicity of the caloric theory appealed to popular science writers. So its use overlapped the birth of thermodynamics.
Even as thermodynamics was gaining academic acceptance, teenagers who went on to enjoy science based careers are likely to have been exposed to the simplicity of caloric theory during their formative years.
Today we are still using some caloric era terms that contradict thermodynamics teaching.
The most glaring example is the use of the term ‘radiator’ to describe a heating panel that exploits conduction, convection and radiation.
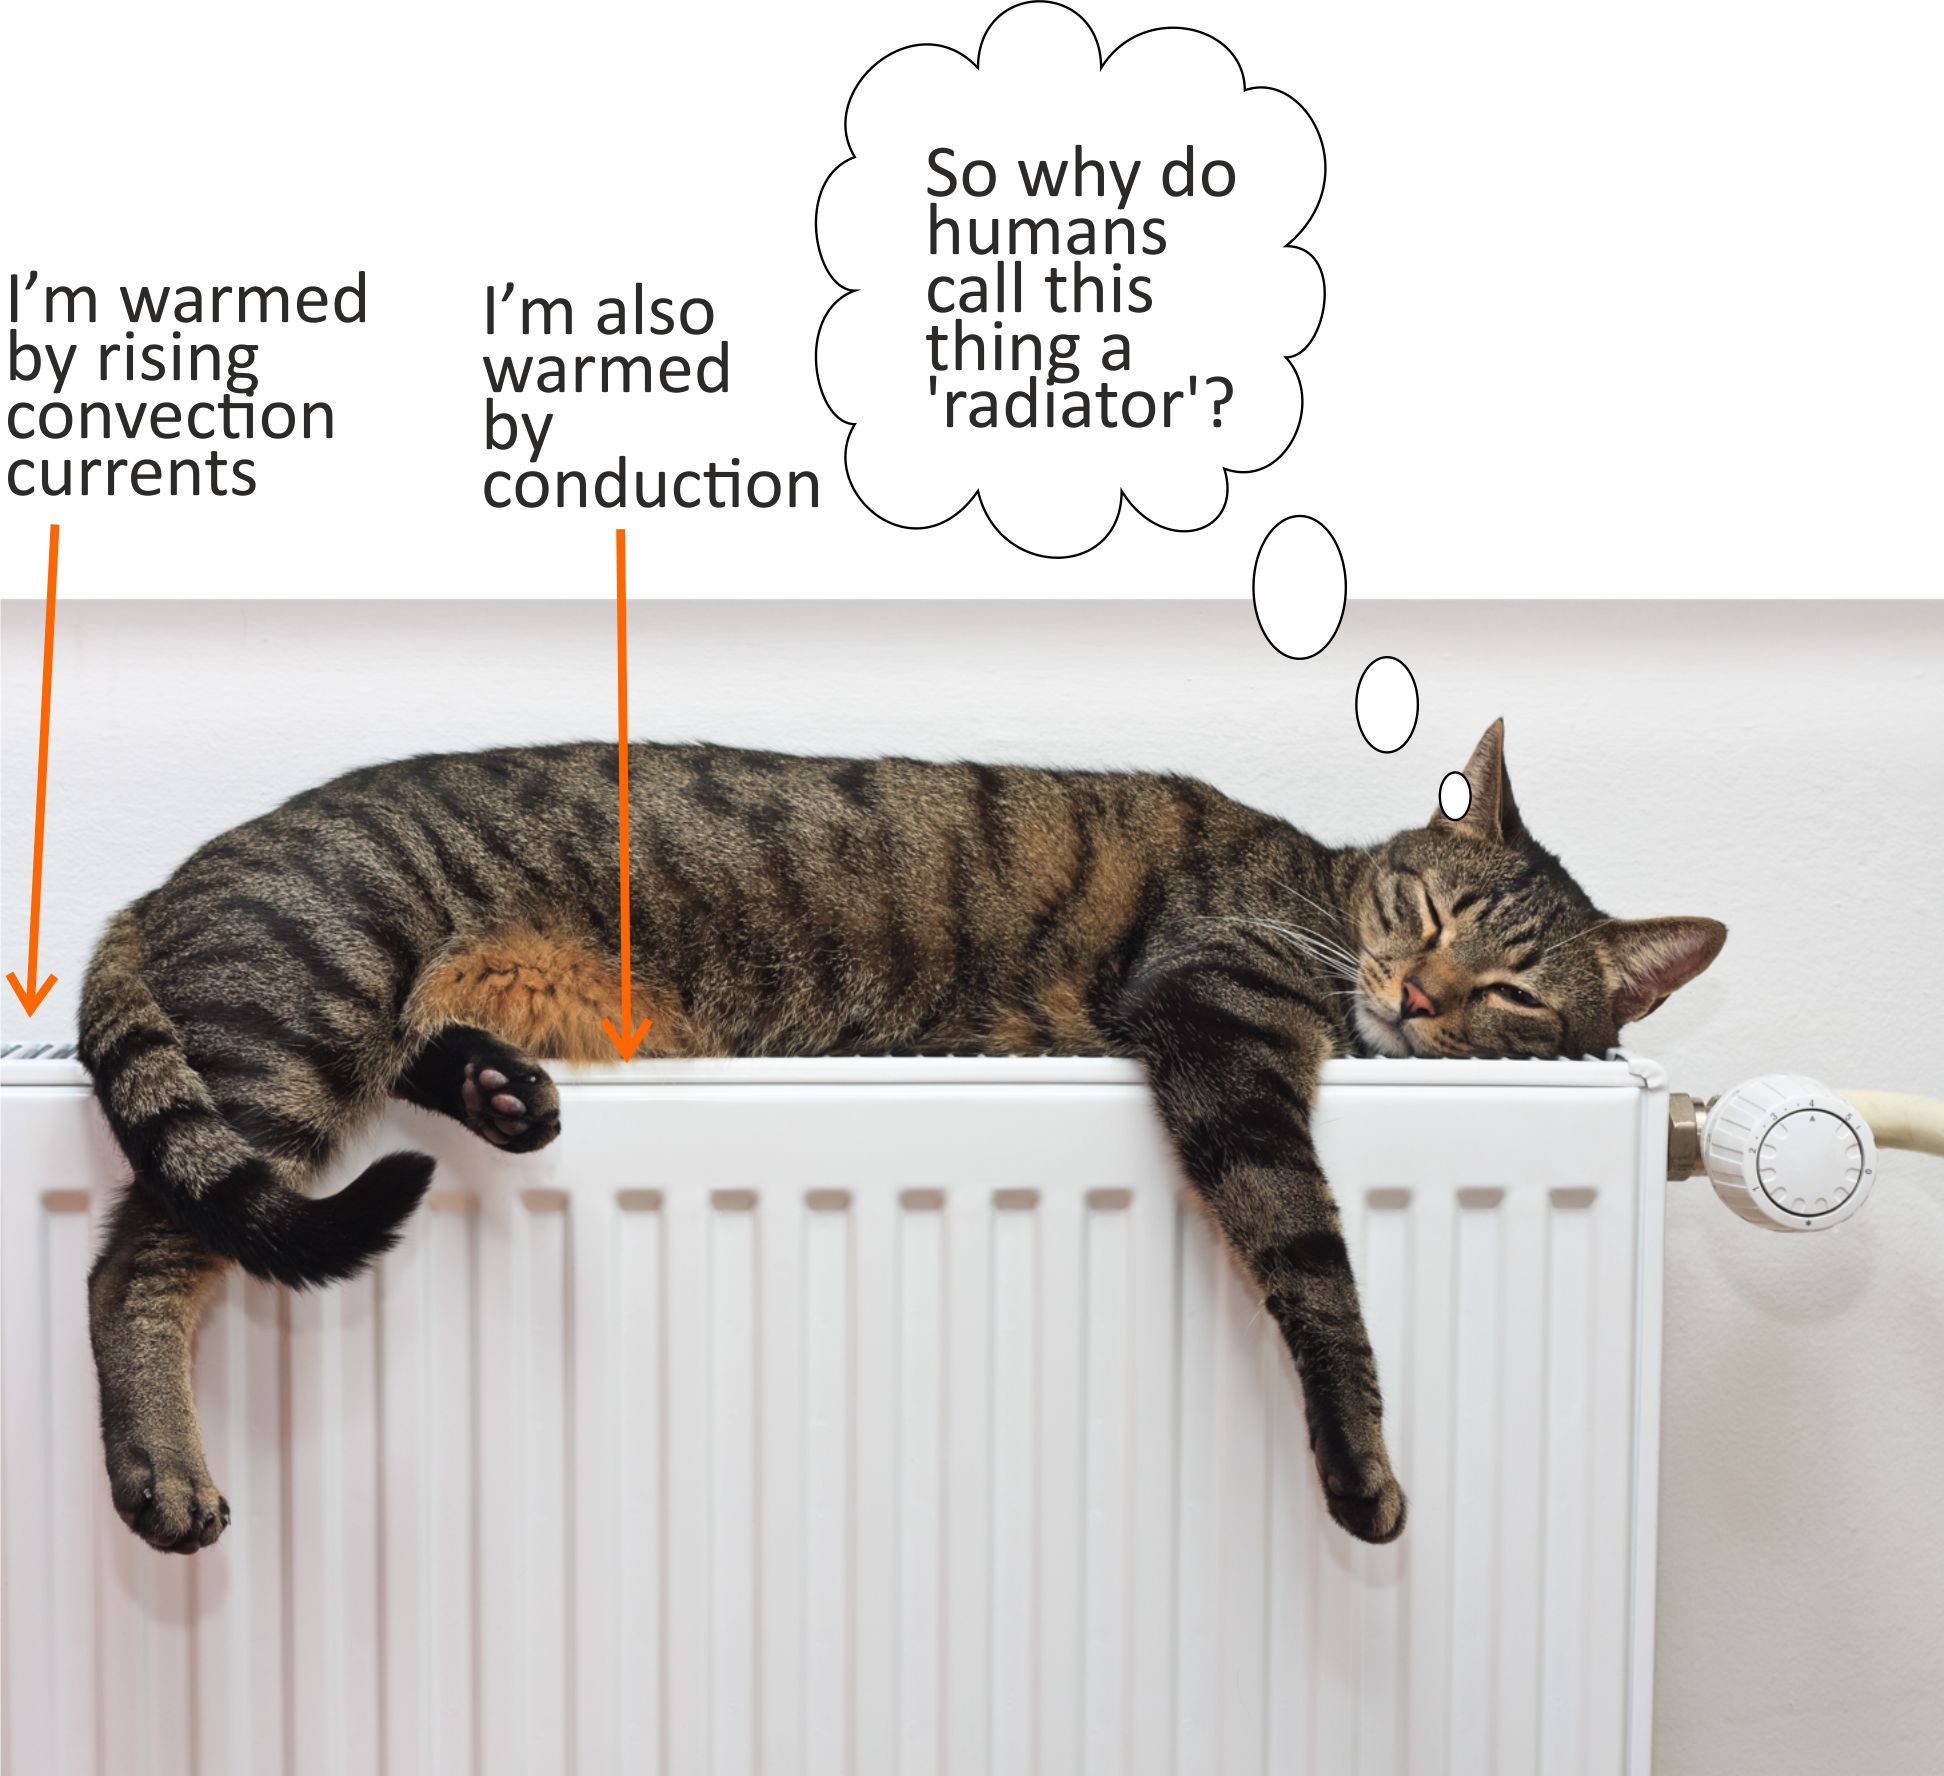
Figure 11. The central heating radiator was invented in the 1850s, in the days when caloric theory and thermodynamics overlapped.
A far more serious case of misleading inheritance is the use of the legacy term ‘heat engine’ when the form of energy actually involved is usually internal energy.
So, we continue to speak of fossil fuel burning engines as ‘heat engines’, instead of ‘internal energy processing engines’.
Here is a comparison between heat and internal energy processing engines.

Fig 12. There is a widely accepted myth that manufactured heat engines reject heat, when in fact, they eject cooled working fluid that still has internal energy.
If ‘heat engines’ really did process heat, there would be no circular ‘heat engine’ systems and there would be no life on Earth. (It would also be impossible to brew a decent cup of tea.)
The ‘heat engine’ error is history repeating itself.
During the first 150 years of industrialisation it made little difference that the caloric theory was completely wrong because basic steam engine operations could be described quite adequately using caloric theory.
Something similar is happening in our modern era because the concept of a heat processing engine is quite adequate for explaining how existing manufactured ‘heat engines work.
The flaws in heat engine theory only show up once it is recognised that convection currents are also ‘heat engines’.
In order to demonstrate that the heat processing concept can unravel, even when considering manufactured engines, here is a comparison involving hot gas and compressed air powered turbines.
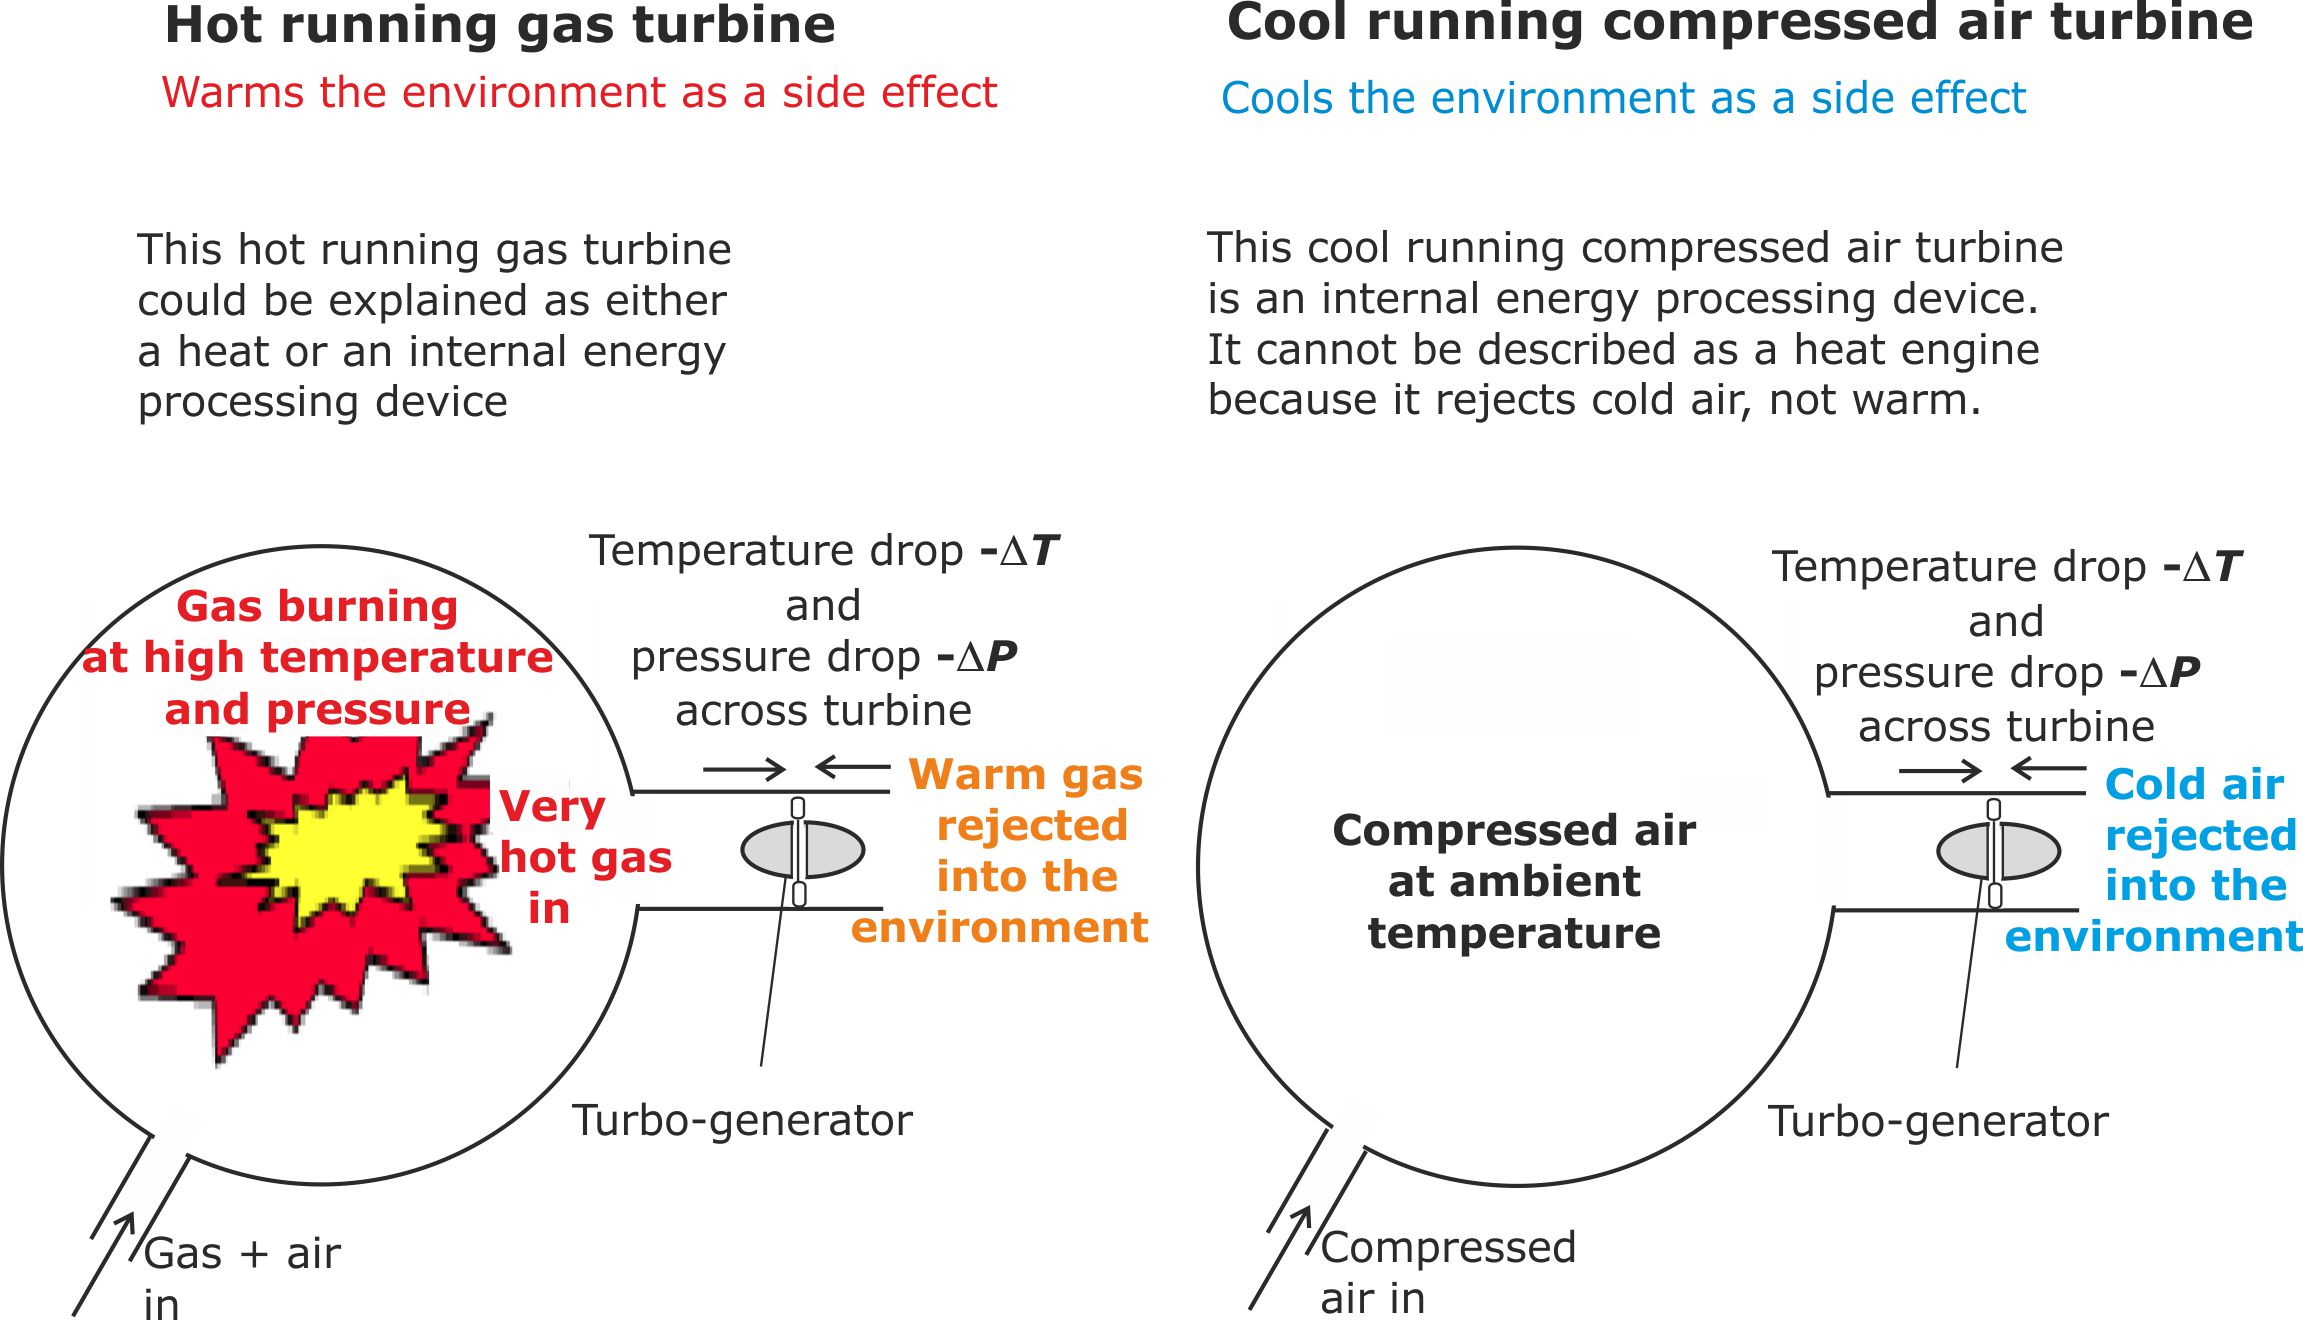
Fig 13. The compressed air turbine has some of the attributes of a heat engine, as exemplified by the hot running gas turbine. Thus, there are temperature and pressure drops across the turbine and its Carnot efficiency can be calculated using the equation, Efficiency h= 1 - TCold/THot.
But it would be impossible for this turbine to dump rejected heat into the environment because the ejected air is cooler than the environment. The only plausible explanation is that a compressed air turbine is an internal energy processing engine that ejects air, taking its internal energy with it.
Please note
In order to avoid confusion, the historical legacy term ‘heat engine’ will be retained in this article.
Today’s engineering and applied science textbooks continue to teach us that circular ‘heat engines’ are thermodynamically impossible, even though Bronze Age people were using them for cooking purposes thousands of years ago!
This is what a Bronze Age circular heat engine system might look like.
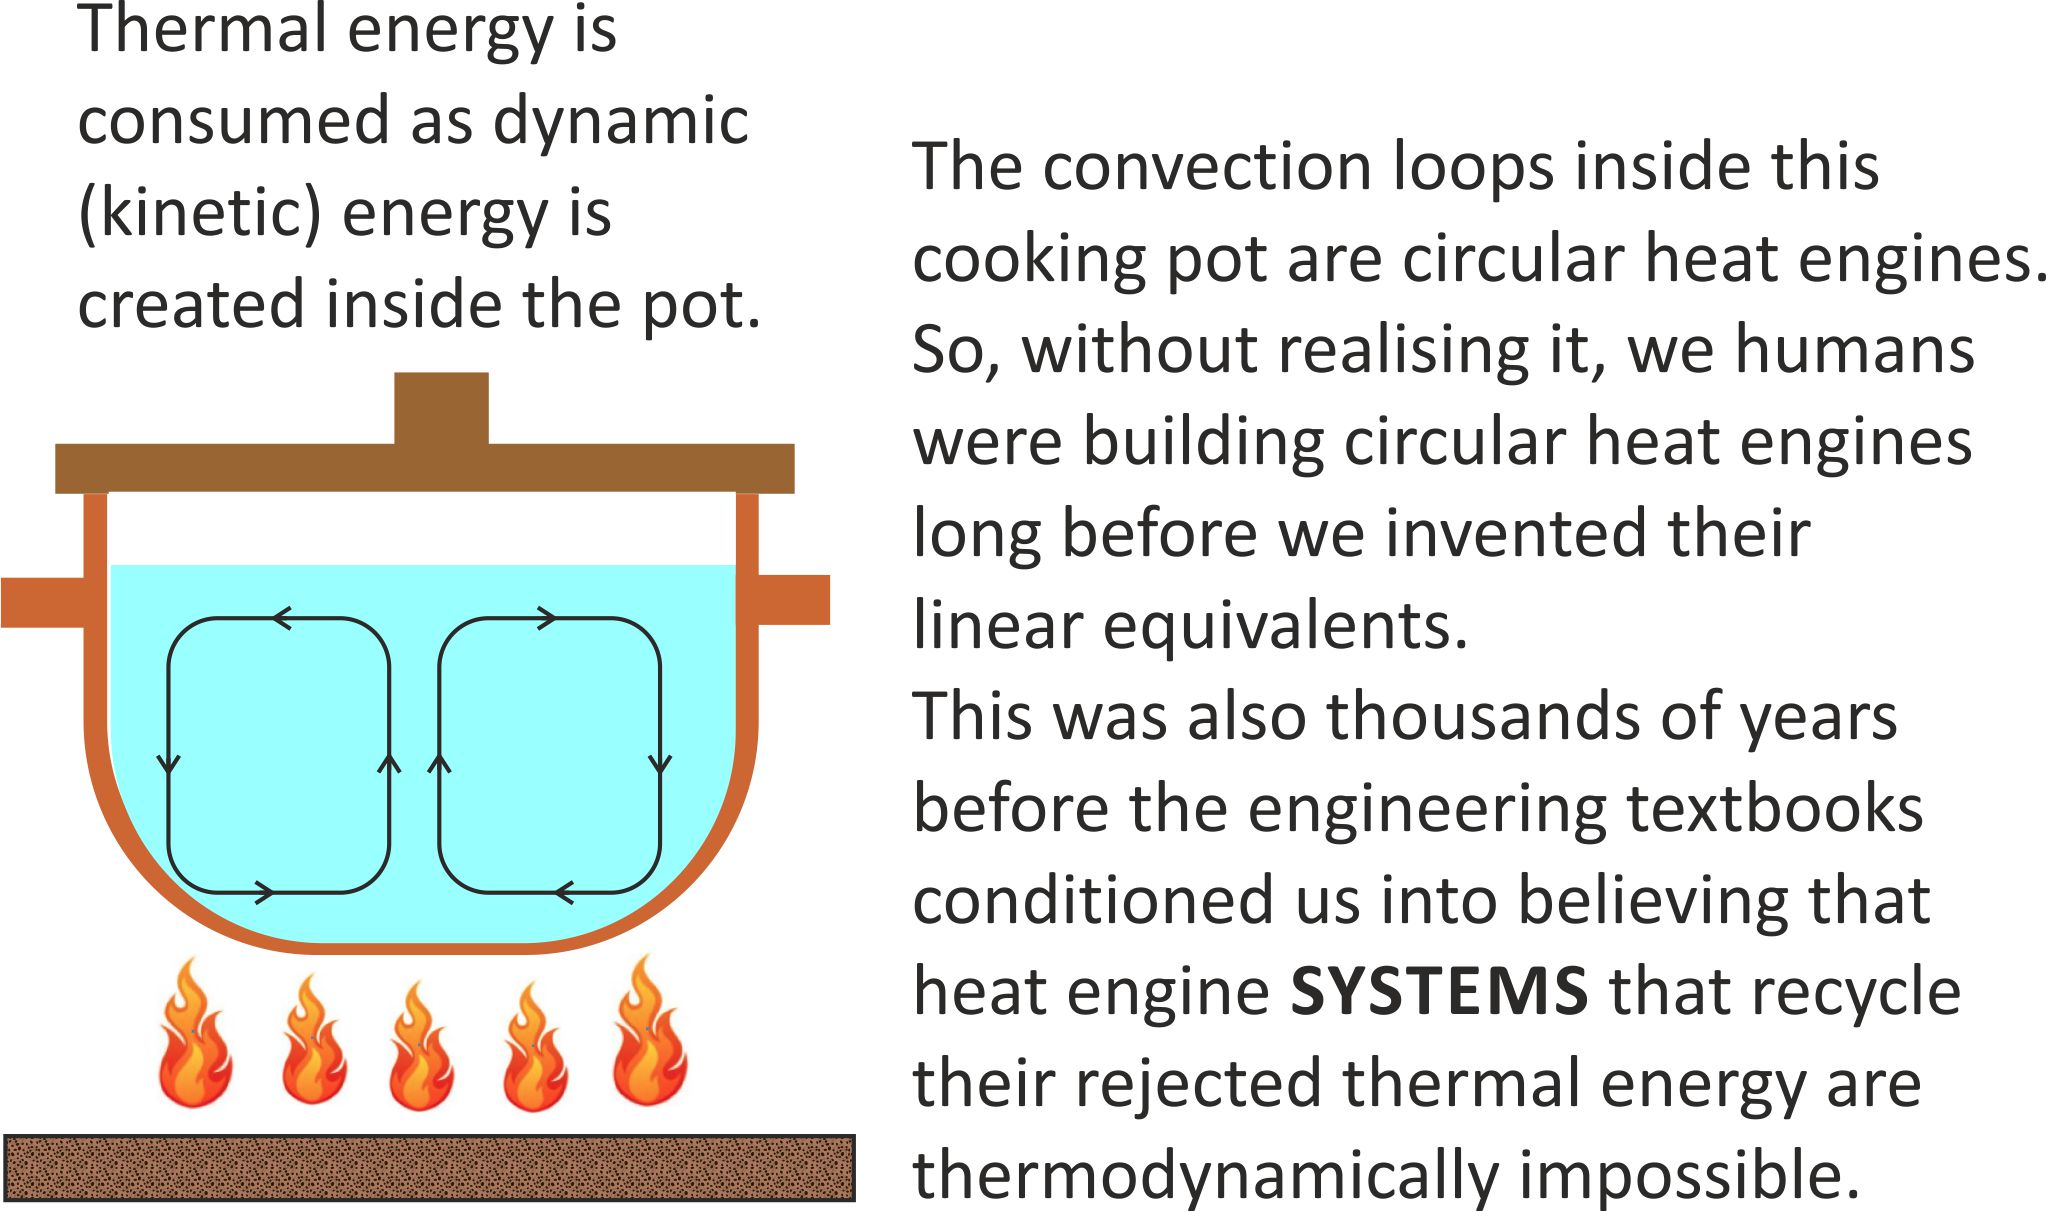
Fig 14. The earliest ‘heat engines’ built by humans were circular systems inside cooking pots. These engines convert thermal energy into the dynamic energy (potential and kinetic) of circulating water.
The cooking pot fire needs to keep burning, to make up for two thermal energy losses.
(i) Thermal energy is consumed by the cooking process because cooking food involves endothermic reactions.
(ii) There are thermal energy (heat) losses to the cooler surroundings.
In contrast, (as explained below), Latent Power Turbines consume thermal energy when they generate electricity, but they also gain thermal energy by running at a lower temperature than their surroundings. So they don’t need the high temperatures created by burning fuel. But they still need to extract heat from their warmer surrounding environment.
The design features that allow the Mk2 Latent Power Turbine to run cool
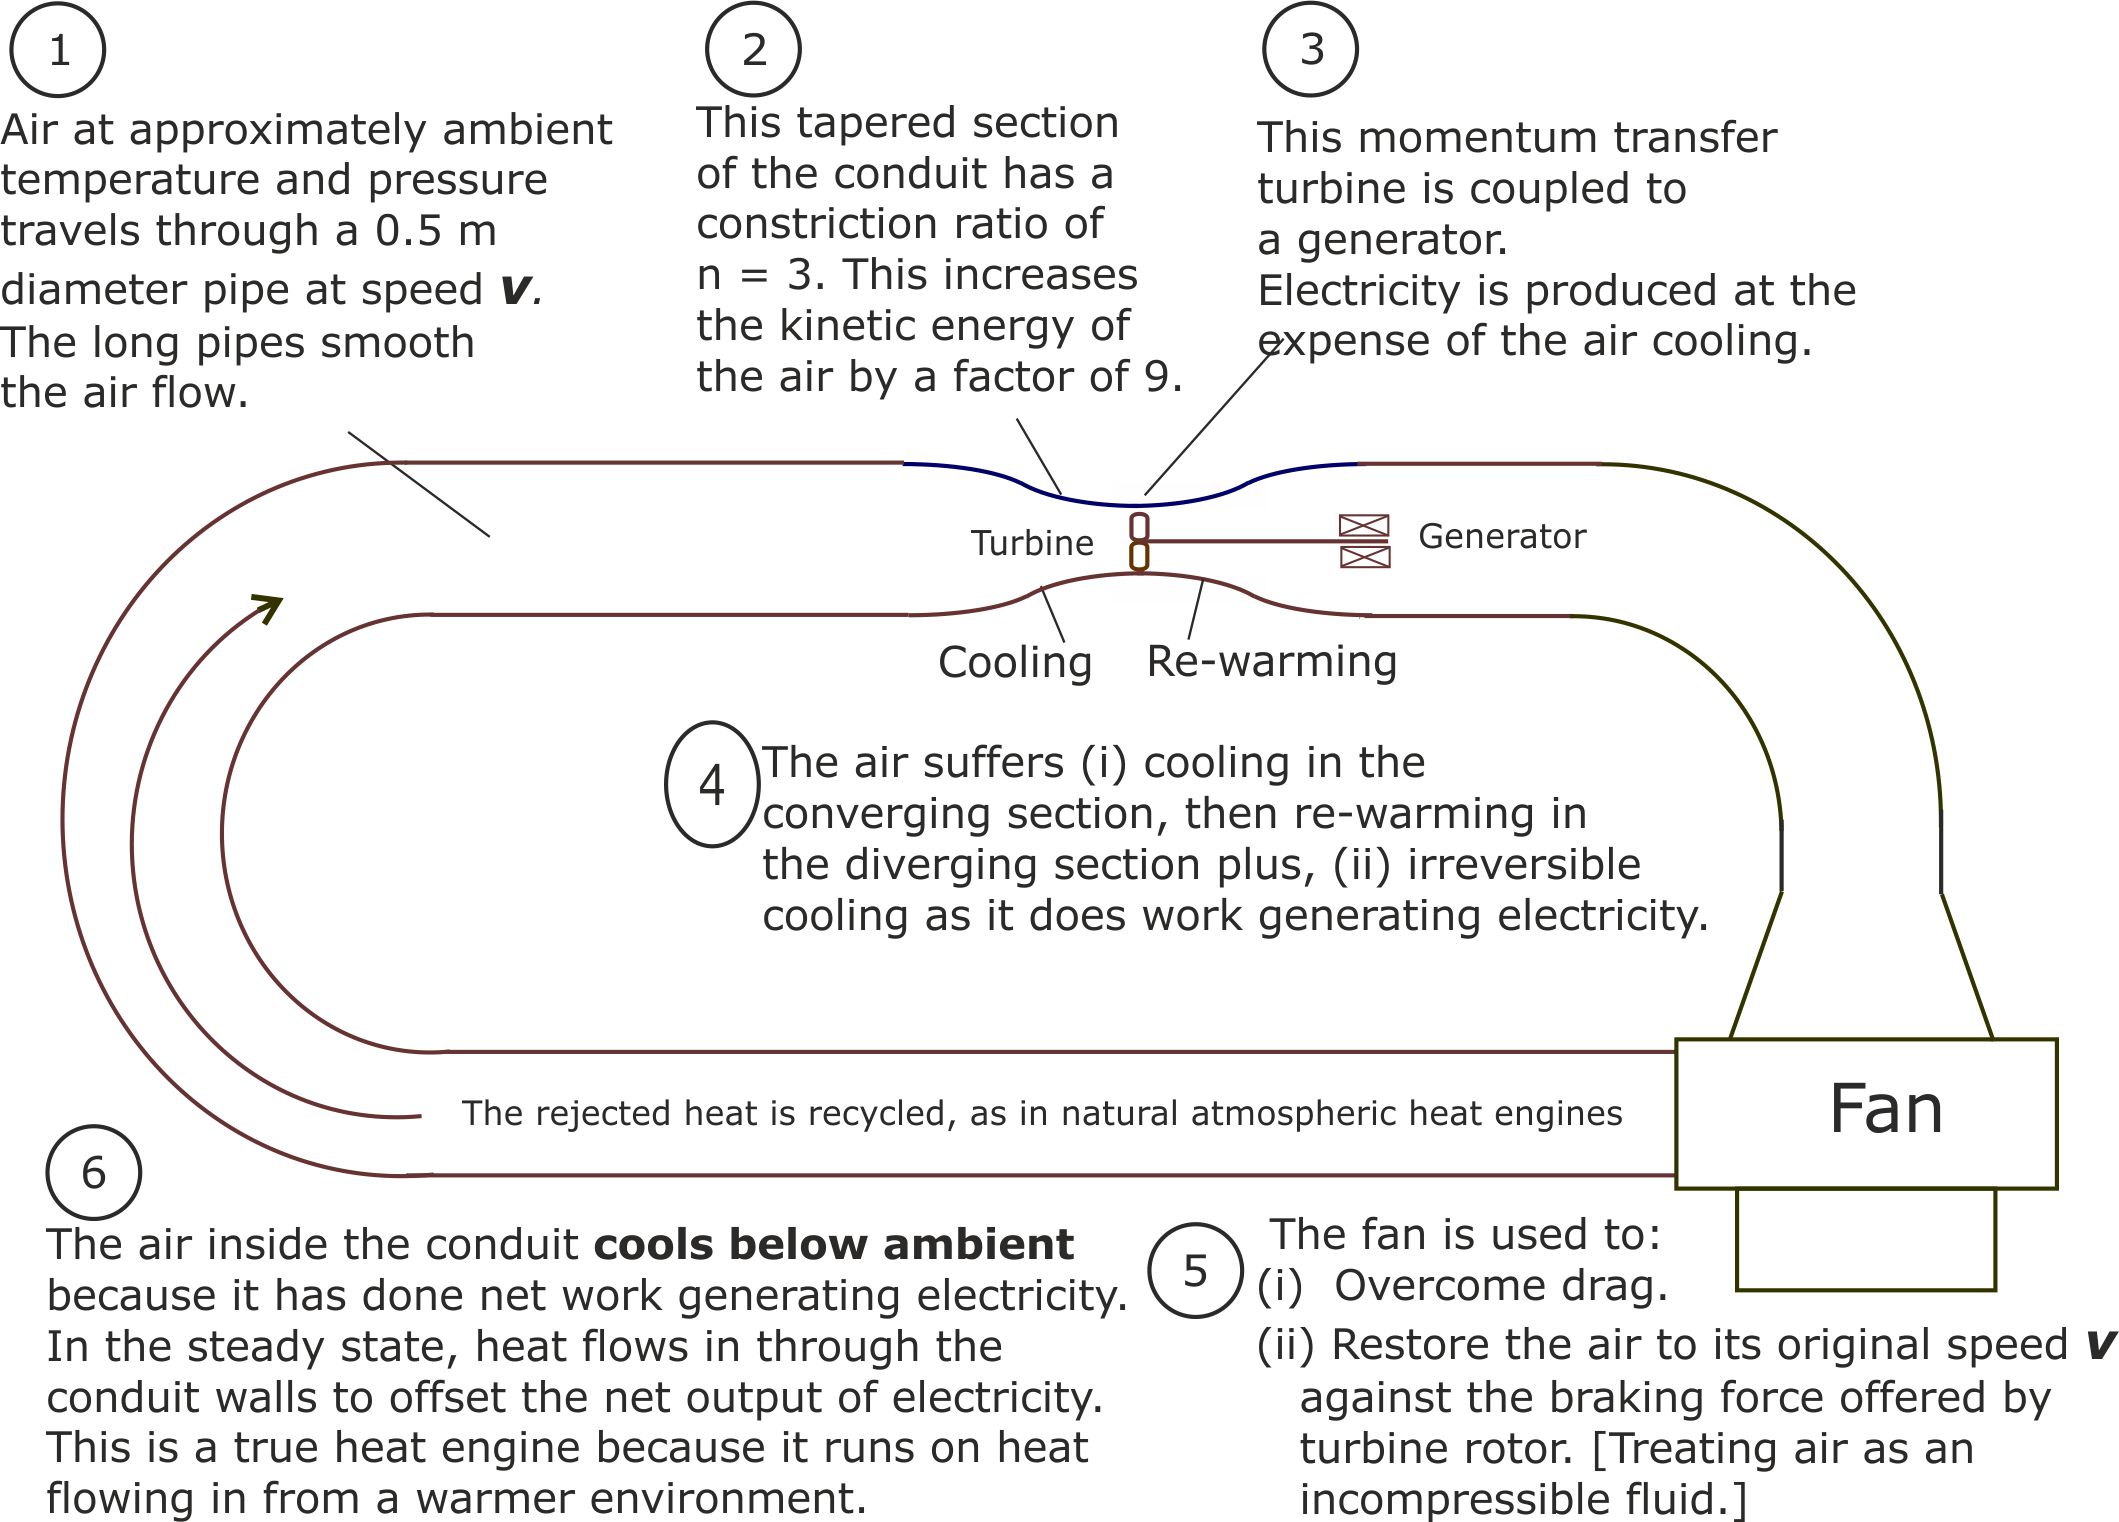
Fig 15. Latent Power Turbines run on thermal energy drawn in from a warmer environment.
A comparison of convection current and Latent Power Turbine systems
(i) Both are circular ‘heat engine’ systems that can recycle rejected thermal energy instead of dumping it.
(ii) Both circular systems are made up of a number of linear heat engines in series.
(iii) Both include at least one heat engine that works in reverse, converting dynamic energy into thermal energy.
(iv) The key difference between them is that convection currents involve reversible changes in potential energy, whereas Latent Power Turbines involve reversible changes in kinetic energy. [This allows them to be more compact than their natural equivalents.]
(v) Both systems achieve high thermal conversion efficiency with requiring large temperature drops across the heat engines.
The following diagram shows the four heat engines that make up a Latent Power Turbine. [All four ‘heat engines’ are involved in processing internal energy, so strictly speaking, they are not heat engines. However the Latent Power Turbine considered as a whole is a true heat engine because it runs on thermal energy extracted from a warmer environment!]
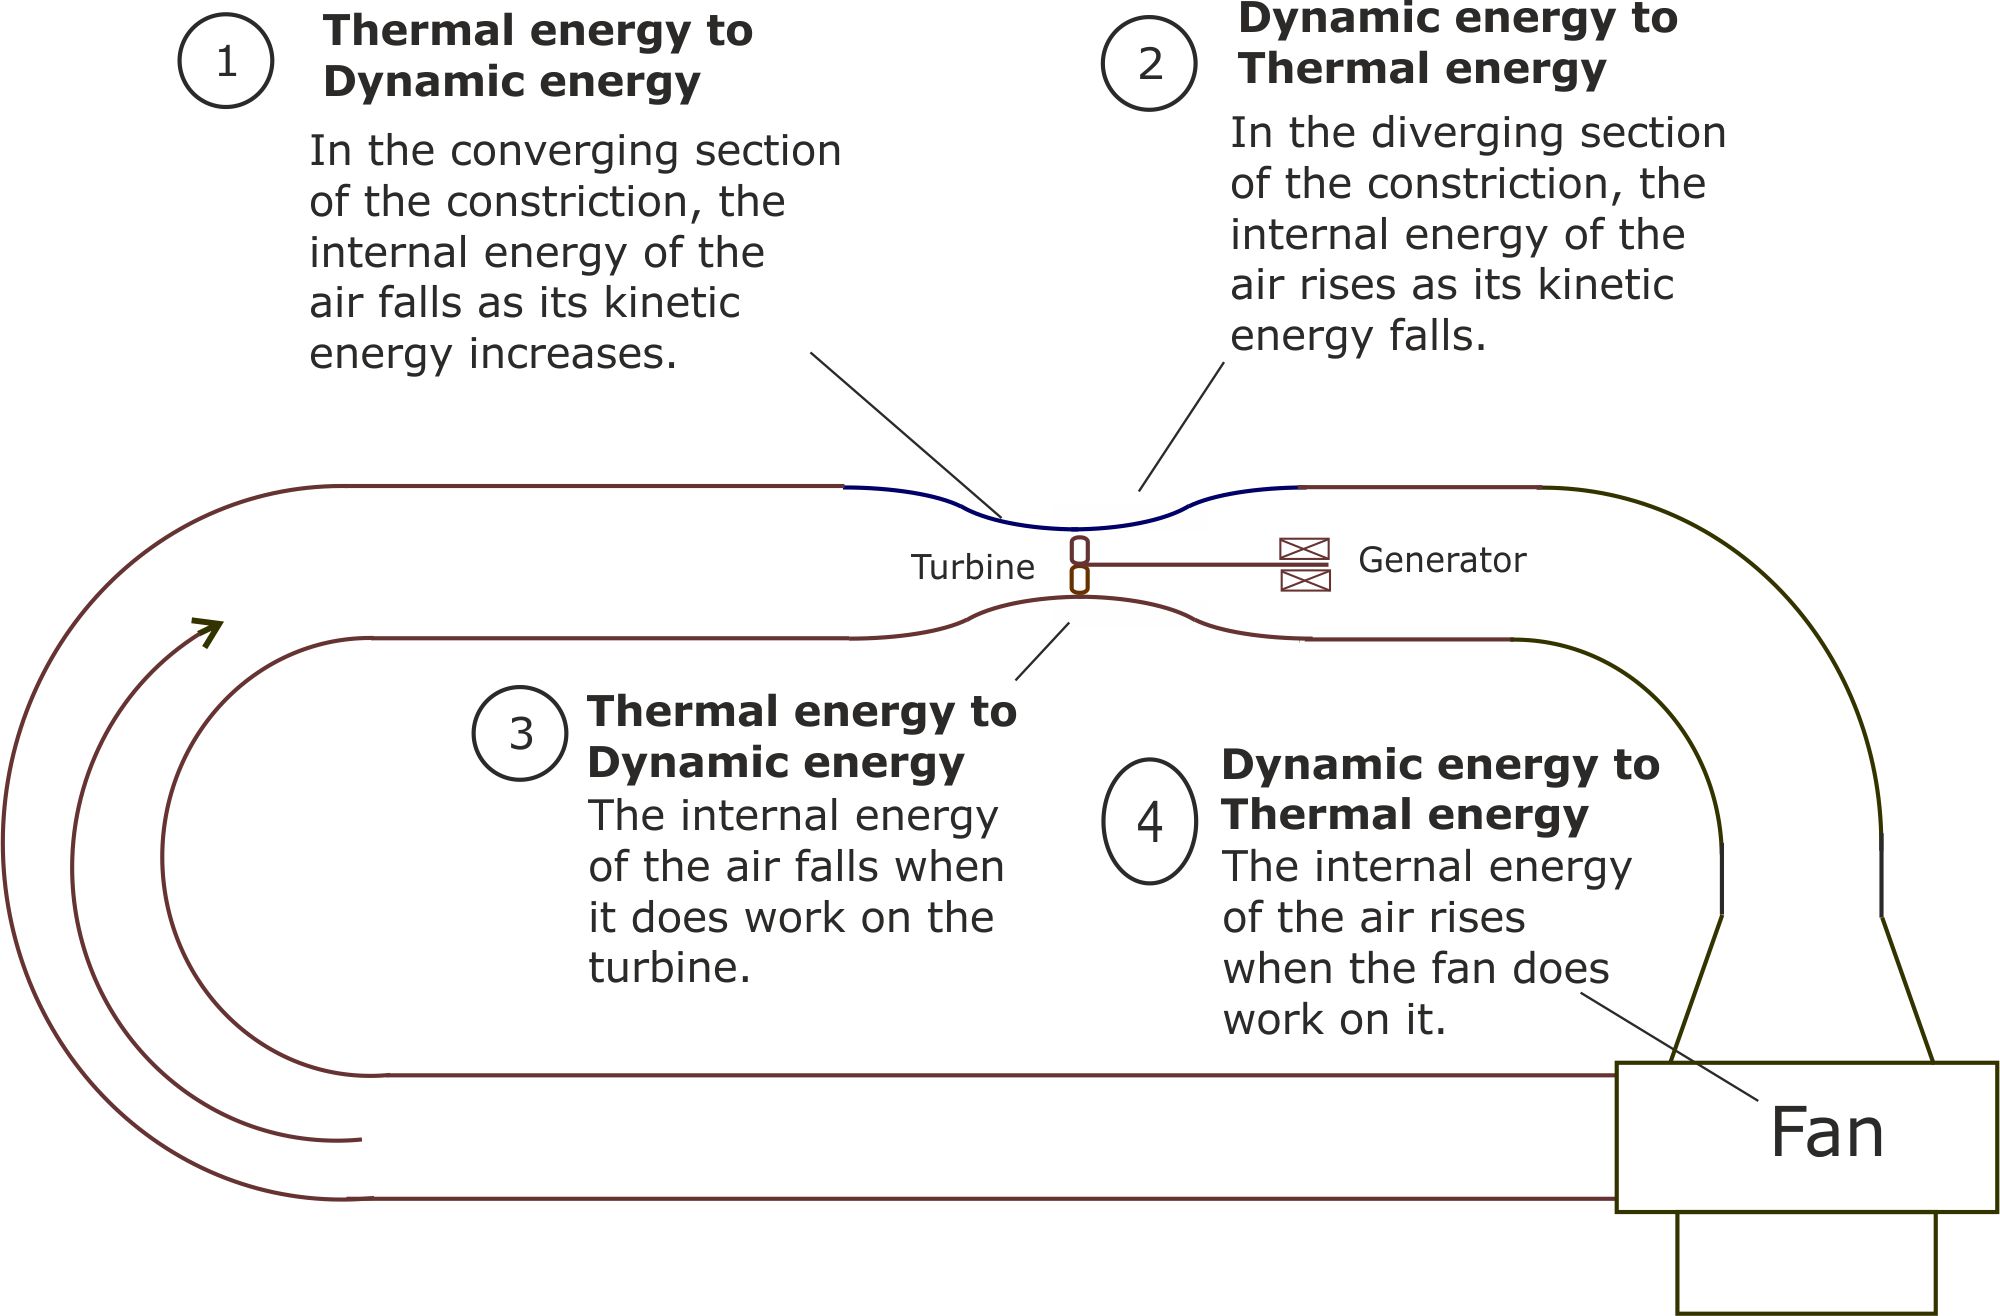
Fig 16. The air moves through the fan at a lower speed than it does through the turbine. So, less electricity is consumed in driving the fan, than is generated by the turbine-generator unit.
The equation relating power output to power input is derived on this linked page.
Why existing heat engine designs cannot be converted into circular systems
Internal combustion engines burn fossil fuels inside the engine. So the gases that emerge from the engine are chemically different from those fed into it. This means that internal combustion engines cannot recycle their working fluid. The only other option is to transfer thermal energy from the exhaust gases to the warmer combustion chamber gases in the form of heat. But heat cannot flow from cold to hot, so recycling is impossible.
Steam turbines look like more promising recycling candidates because no chemical changes take place inside the engine.
Steam enters the turbine at a high temperature and pressure. Both fall along the length of the turbine with cool, low pressure steam emerging.
Two separate processes take place in parallel inside the turbine, with both causing drops in temperature and pressure.
(i) A pressure drop is required to accelerate the steam to a high speed so that it can drive the turbine. This results in a drop in steam temperature. Thus, the pressure drop causes the increase in speed and the temperature drop follows as a consequence.
(ii) The steam loses internal energy and cools when it does external work driving the turbine. When the steam temperature falls, the steam pressure also drops as a consequence.
There is also the problem that steam is a vapour. So it has to expand as it moves through the turbine to avoid becoming saturated and condensing out as fast moving water droplets.
The only way of restoring the steam to its origin condition is to do work on it by compressing it again. This would be futile, because there would be no resultant output of work.
We can conclude that the recycling of rejected thermal energy by any of our fossil fuel burning engines would have been impossible, whether or not we had mistakenly classified them as heat processing engines.
In an Latent Power Turbine dry air is used, so there are no condensation problems.
In addition, the pressure reduction takes place in two separate stages, making reversal easier.
(i) There is a reversible ‘heat engine’ process.
Before it enters the turbine, the moving air is forced to accelerate by the converging shape of the constriction walls. As it speeds up it also cools, making this a ‘heat engine’ process. It then slows down in the diverging section after exiting the turbine.
(ii) There is a hot to cold heat flow process.
As with a steam turbine, the internal energy of the working air falls when it does work driving the turbine. This is observed as falls in temperature and pressure along the turbine. This cooling is reversed when heat flows in through the metal conduit walls around the loop. The increase in temperature also causes an increase in pressure. This has no effect on the rate of air flow because the pressure increase takes place equally in both forward and backward directions.
Latent Power Turbine can operate anywhere on the planet, from the Sahara to Siberia because the temperature at the turbine inlet is always below ambient.
[Icing up will be a nuisance in cool climates, but there are several solutions to this problem.]
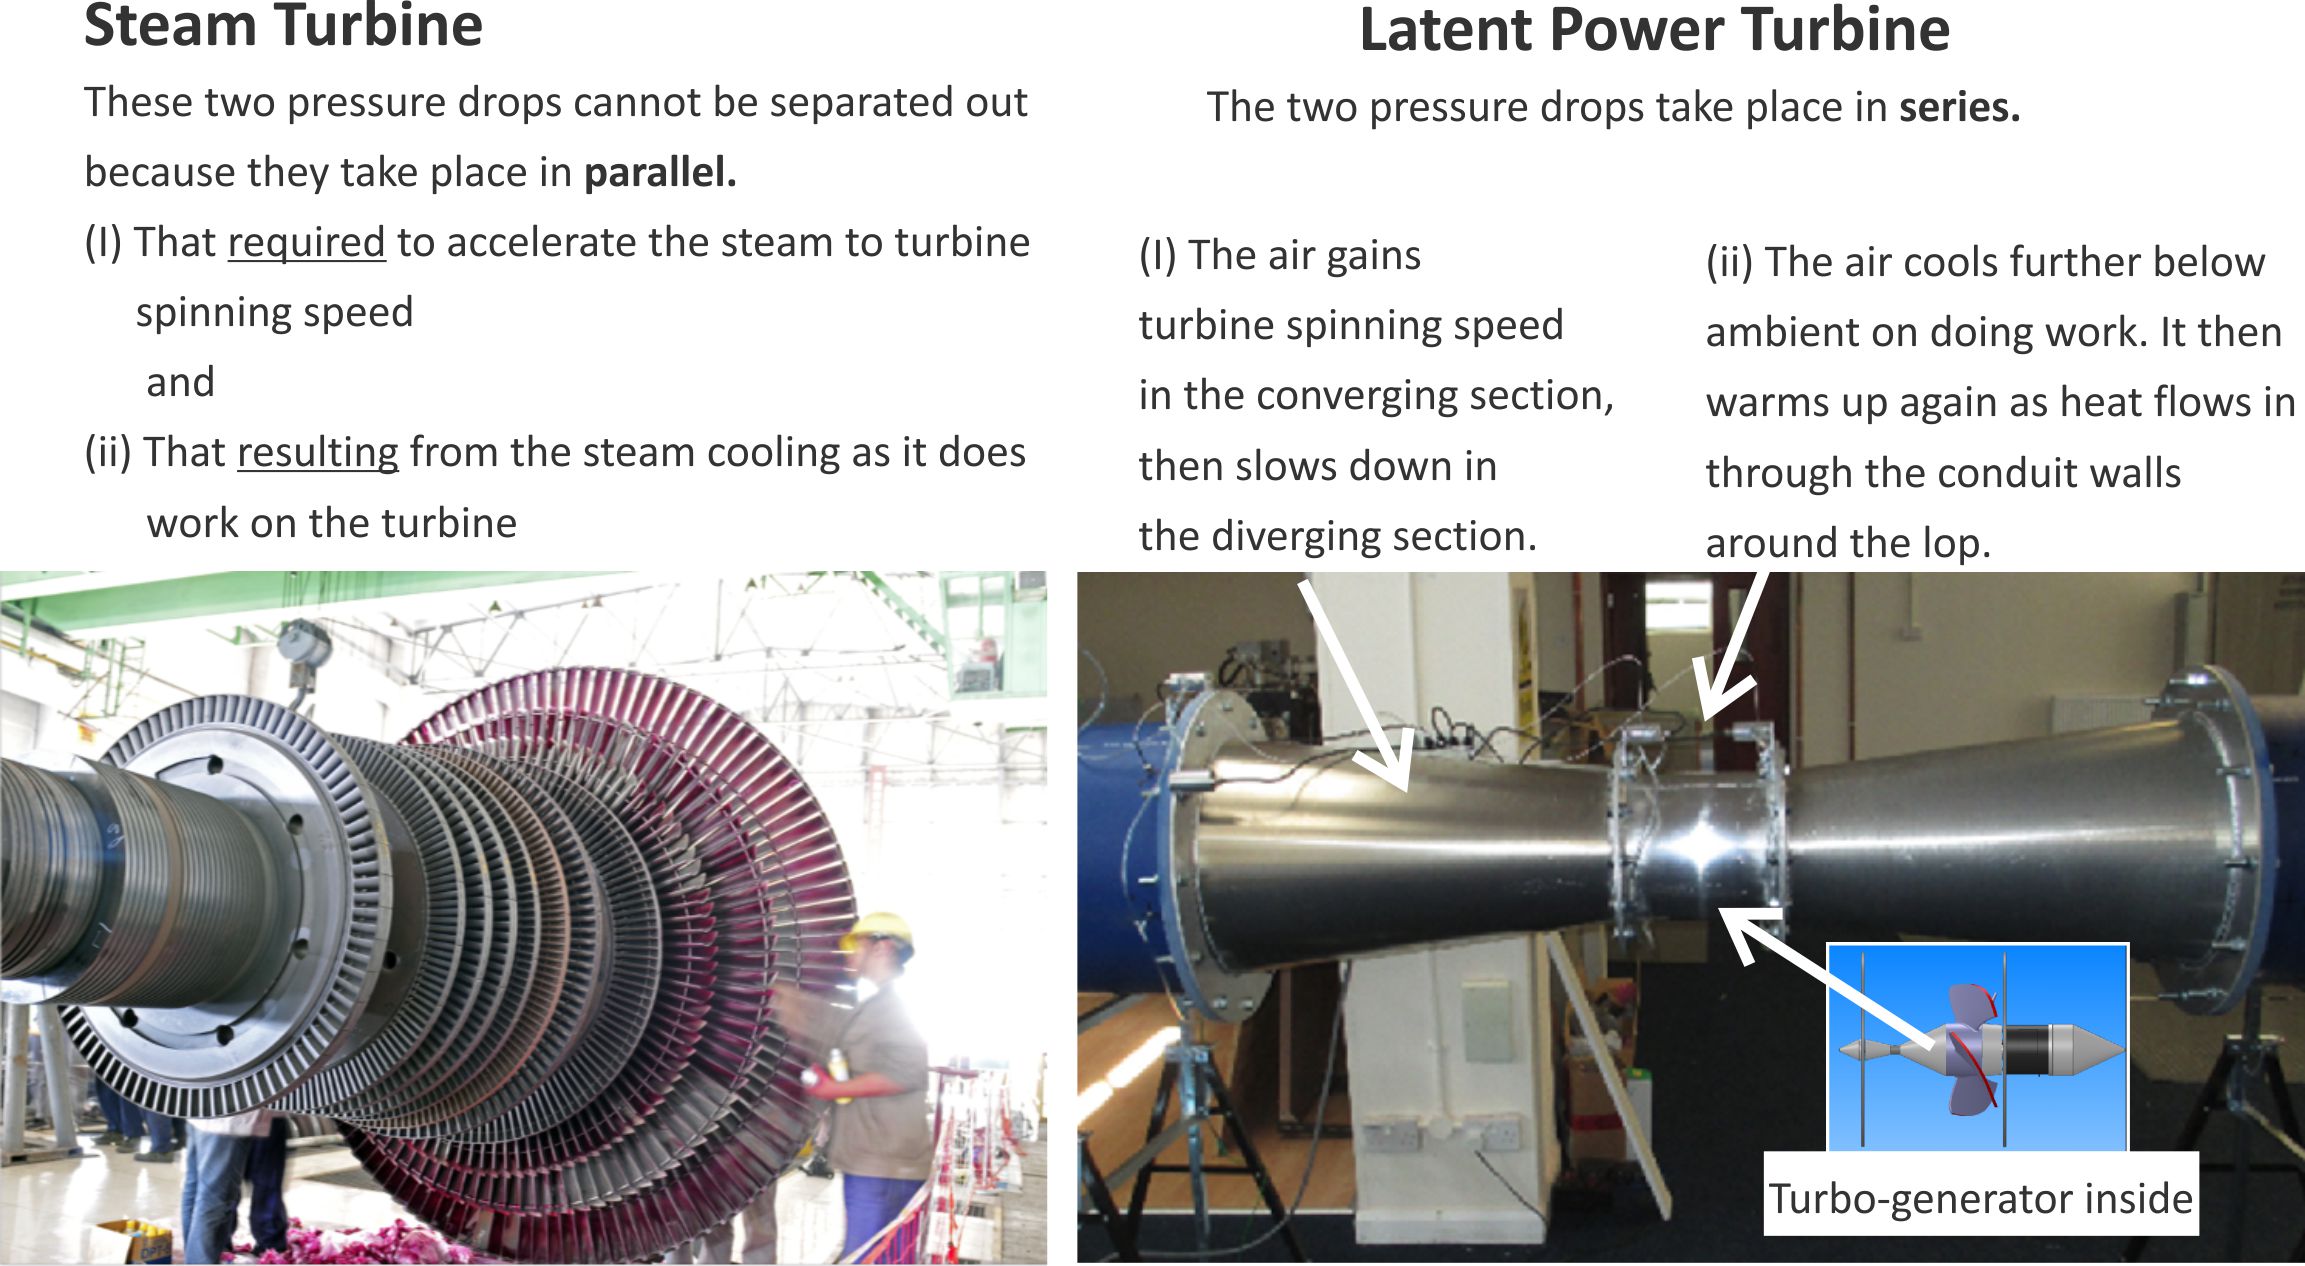
Fig 17. Latent Power Turbines are able to separate out the two causes of temperature/pressure drop in a way that is not possible inside a steam turbine.
The price that has to be paid for the benefits of separation is that some work has to be done on the working air by the fan.
In addition, the fan has to do work to overcome the drag forces which try to slow down the air as it moves round the loop.
Drag forces become proportionally larger as the size of the Latent Power Turbine shrinks. This will ultimately dictate the smallest size of Latent Power Turbine that can deliver a net output of power.
For the moment it is being assumed that a Latent Power Turbine the size of a public telephone box will generate sufficient electricity to meet all of the needs of a family of four. With luck, it may be possible to make them significantly smaller.
Current state of development
With the support of Innovate UK funding, the shell of the Mk 2 test rig was built, instrumentation was added and a makeshift turbine rotor was installed. Preliminary tests indicated that all the temperature and pressure changes around the loop were in line with predictions
Here are a typical set of proof of concept experiment results.
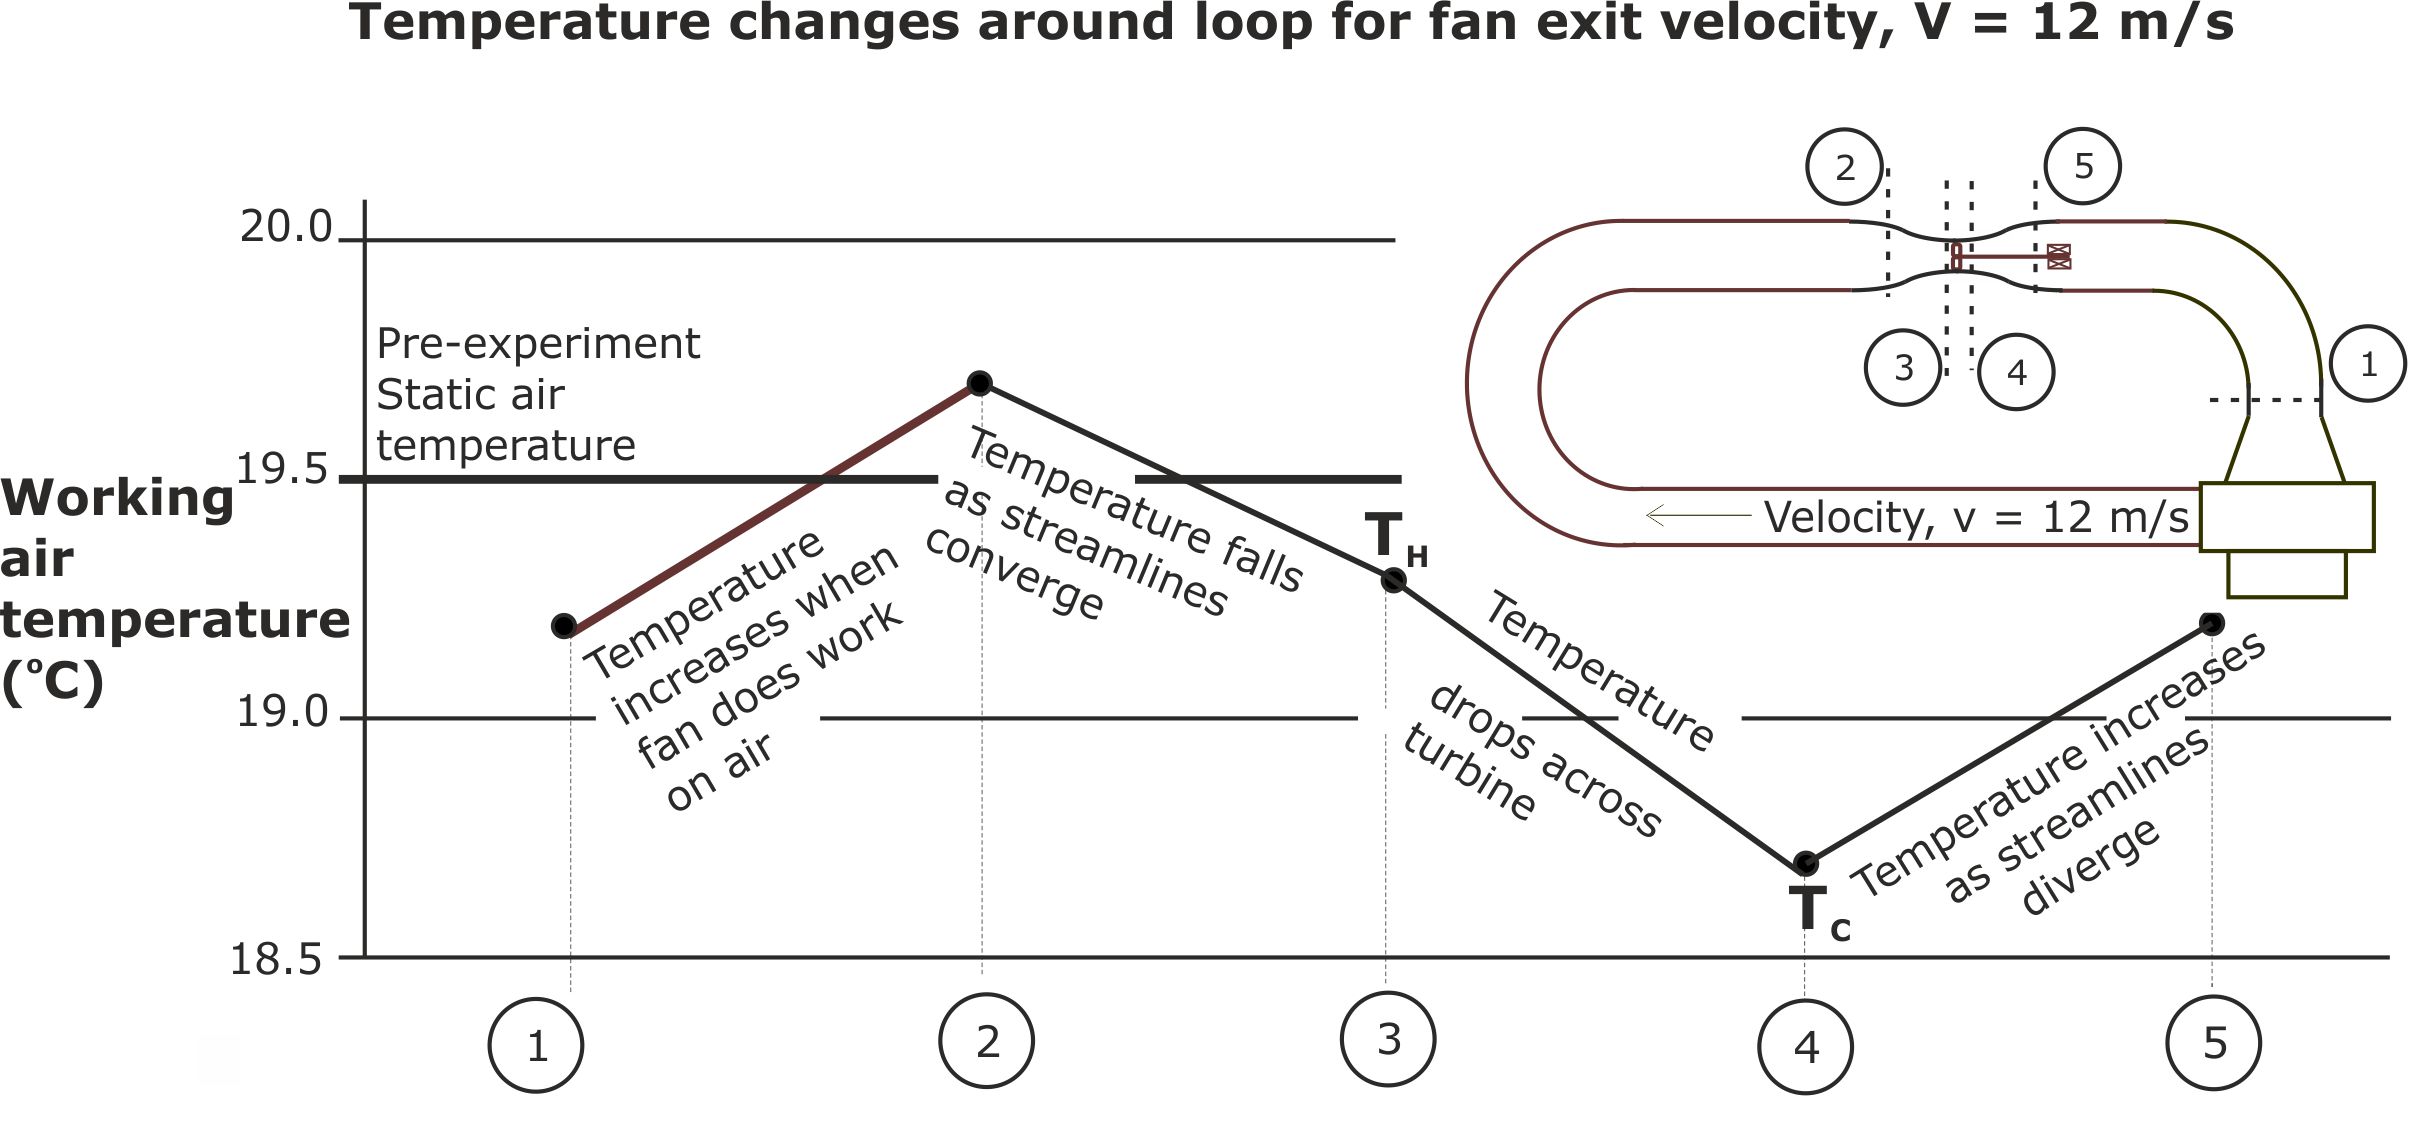
Fig 18. Sample project results as presented in the final report, for the funding body, Innovate UK. [Innovate UK (TSB) Project. 131512.]
The temperature rose and fell around the loop in line with predictions. There were corresponding changes in pressure around the loop.
According to the project plan, the final stage of development required the installation of a bespoke turbine rotor. For this, a UK or European partner with turbine design skills was required.
Unfortunately, this partner search coincided with the UK’s referendum vote to leave the European Union. As a consequence neither British nor European companies were interested in working with us because we had lost access to European research funding and the future for British engineering was very uncertain.
The Latent Power Turbine intellectual property was jointly owned by Bill Courtney and Richard West of Latent Power Turbines Lt.
We battled on until 2020, in the hope of a good outcome for us from the Brexit negotiations, but our hopes were in vain.
We eventually ran out of funds to pay the patent application fees and the people storing our bulky test rig ran out of goodwill. So we gave the rig away for use as a wind tunnel and wound up our company Latent Power Turbines Ltd.
We were originally motivated by a combination of British patriotism and a desire to help fight climate change. But, following the Brexit disaster, the only way open to us way to continue the fight against climate change by declaring Latent Power Turbines as open source technology.
As you can see from the other pages on this website, Latent Power Turbines offer vast scope for improving the lot of humanity and there are many opportunities for entrepreneurs to become rich.
Here are a few variations on the research test rig that have greater commercial potential.
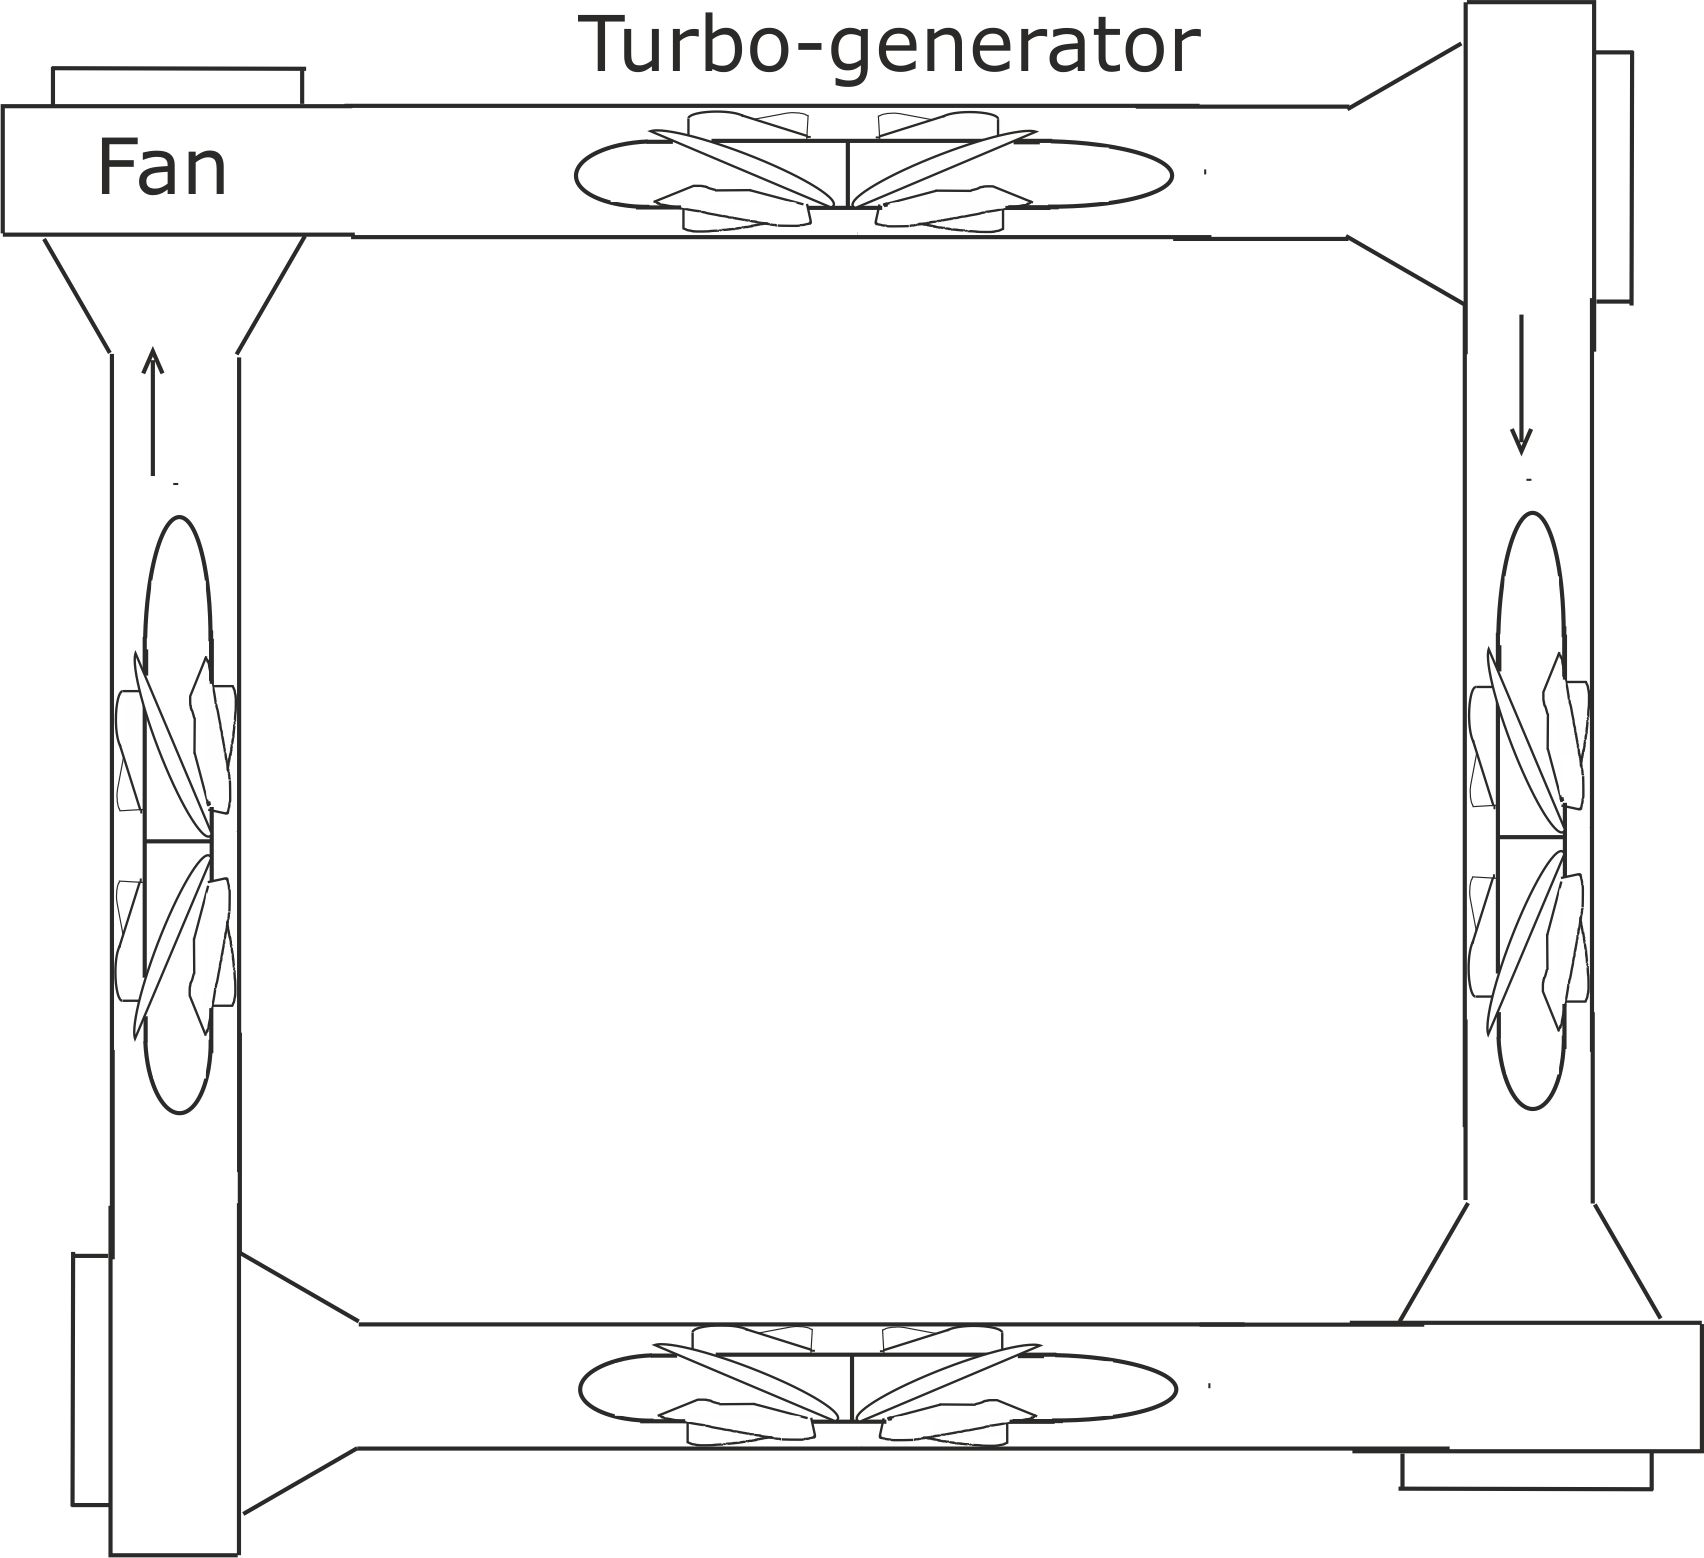
Figure 19.
This is one of the daisy chain loops described in our patent literature. Note the use of parallel sided conduits and counter-rotating turbines.
For domestic and small business purposes, the following plenum chamber design will be more compact.
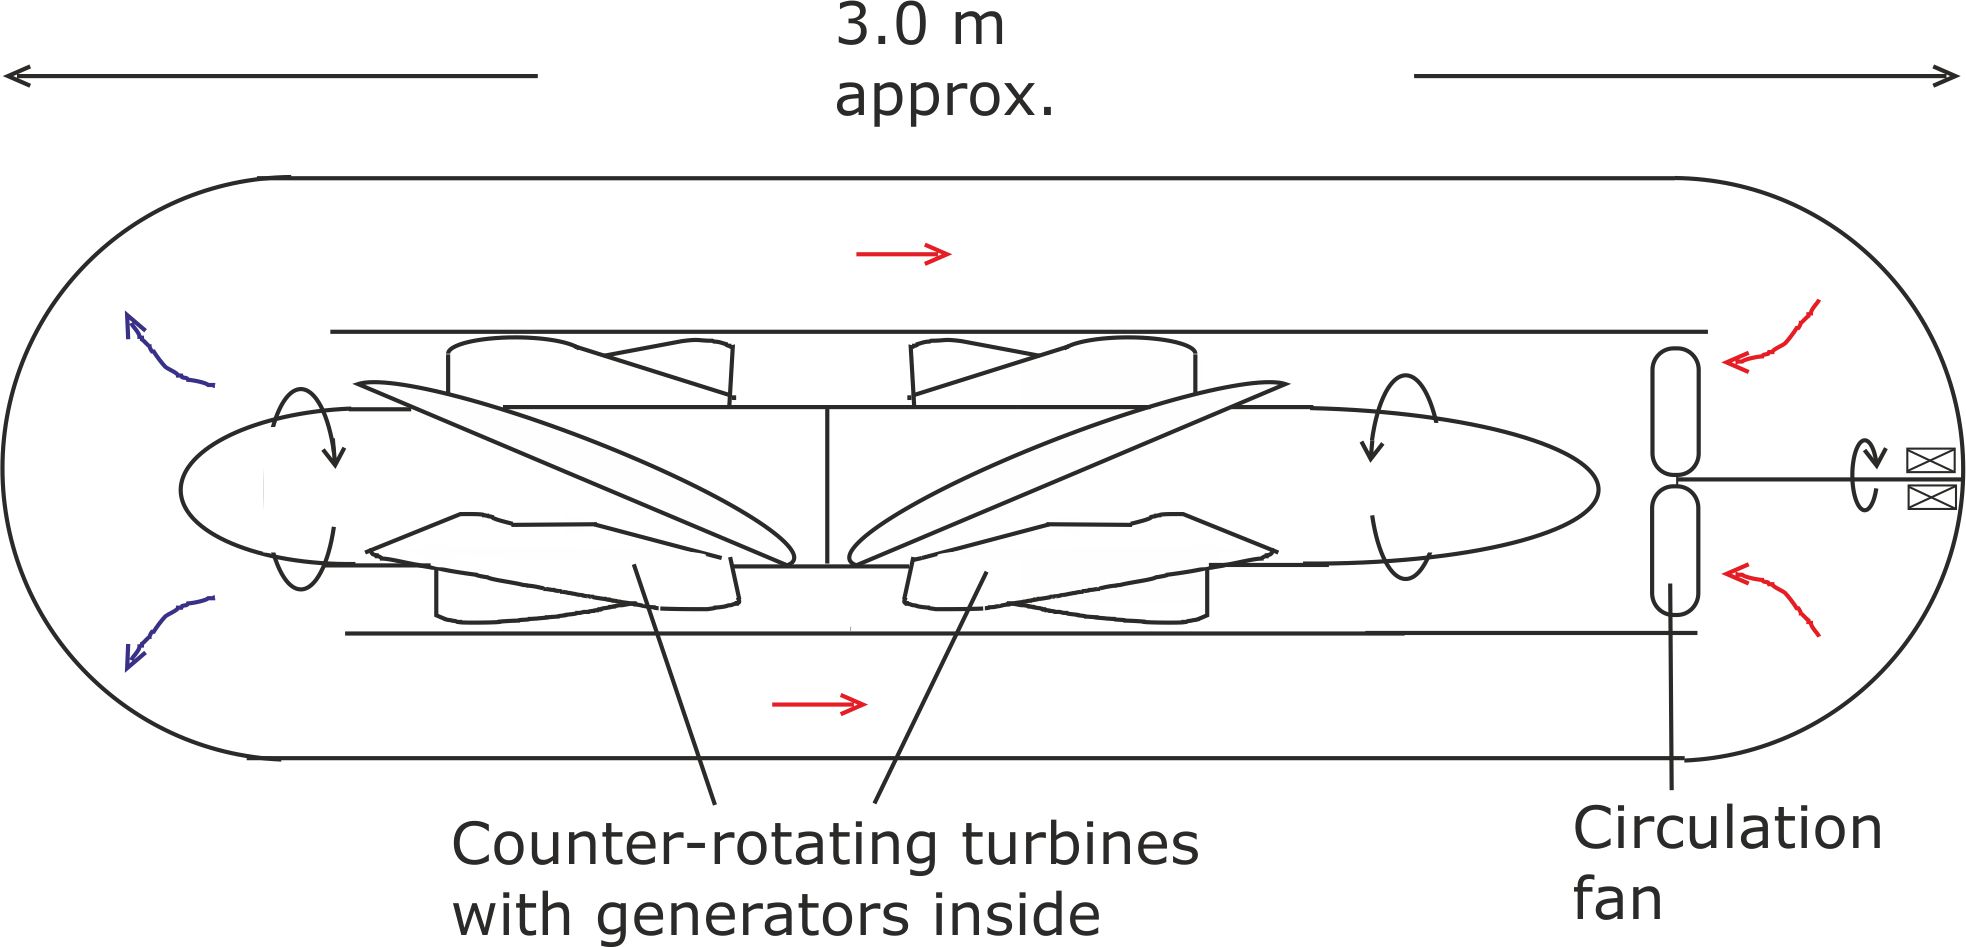
Figure 20. Plenum chamber Latent Power Turbine.
A power unit with a greatly increased constriction ratio could make the design more compact. Here is one design option.
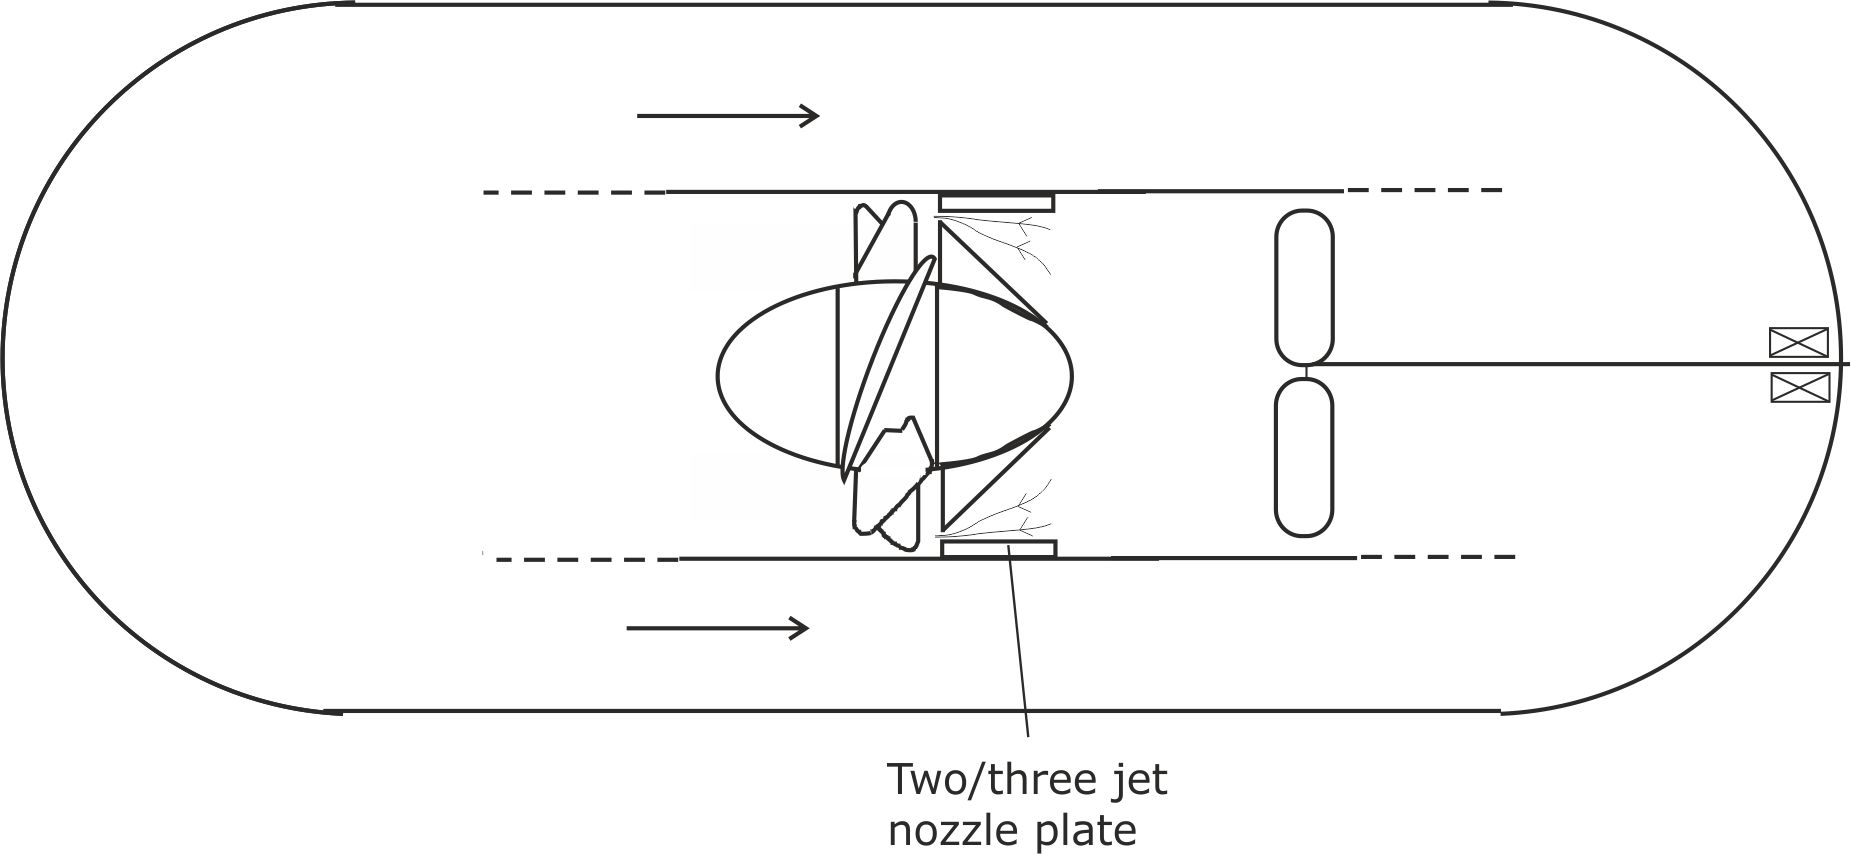
Figure 21. By using two or three nozzles to accelerate the working air flow before it hits the turbine, its kinetic energy can be increased.
Potential transport applications. Using this arrangement, it may be possible to shrink the design so that it can be used to provide drive power in road vehicles. In hot climates, this unit could run off heat extracted from the atmosphere all year round. In cooler climates, where icing up could become a problem, thermal energy supplied by burning hydrogen may be needed.
Finding out more
1 Details of the many ways in which LP Turbines could change our future future
3 Using Latent Power Turbines to solve our water shortage problems
4 Using Latent Power Turbines to defeat terrorism
5 Eliminating extreme poverty within 10 years
6 More detailed technical information is provided on this page
7 A philosophical 'Black swan' interpretation of Latent Power Turbines
Acknowledgements
IInnovate UK (A British government agency) funded our early research at Lancaster University. We then went on to win £98,400 additional Innovate UK funding to test our deigns on a larger scale. The larger rig, as illustrated on this page, was built for us by C-Tech Innovation Ltd.
Bill Courtney is the principle Latent Power Turbine inventor, with Richard West also making important contributions. Without West’s support, Courtney would have given up in 2006, when he was fighting university research fraud relating to his Shock Absorbing Liquid invention.